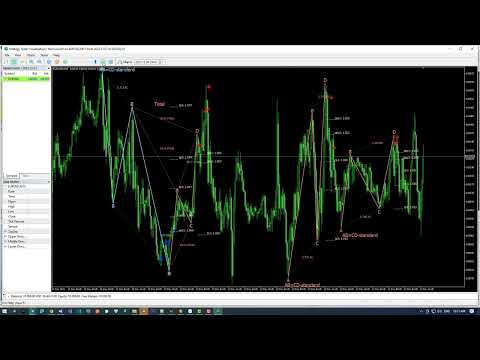
Harmonic plus Zup Patterns with reveser confirm
- Indicadores
-
Minh Truong Pham
 Hello, my name is Pham and I am a programmer and trader! At here, I create amazing forex indicators and expert advisors for Metatrader.
I will try:
+ Provide best tools base on my 5 years experience as a trader and 10 years as a programmer. - Versión: 1.2
- Actualizado: 22 marzo 2023
- Activaciones: 5
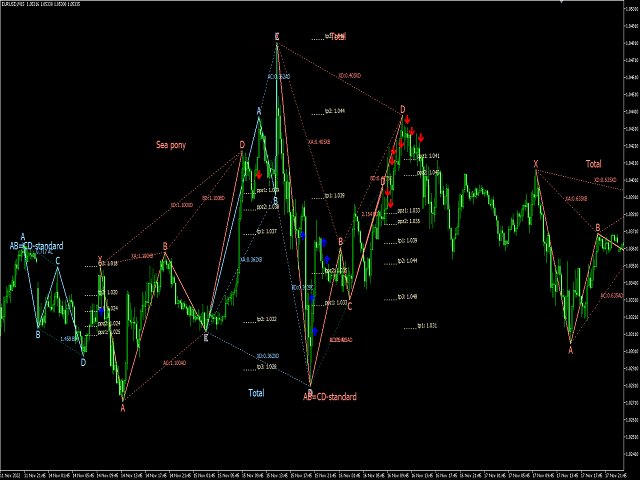
El concepto de patrones armónicos fue establecido por H.M. Gartley en 1932. Los patrones armónicos se crean mediante 4 picos (ABCD) o 5 picos (XABCD). Tradicionalmente, tenemos el patrón BAT, el patrón Gartley, el patrón mariposa, el patrón cangrejo, el patrón cangrejo profundo y el patrón tiburón. Cada patrón tiene su propio conjunto de fibonacci. En este indicador, añadimos un patrón más extendido llamado patrón ZUP. Así que tenemos un total de 37 patrones como sigue
Este indicador detecta todos los patrones anteriores, toma las proyecciones de fibonacci tan en serio como usted, muestra la Zona de Reversión Potencial (PRZ) y encuentra niveles adecuados de stop-loss y take-profit.
- Detecta 19 formaciones armónicas de precios diferentes.
- Traza proyecciones de Fibonacci primarias, derivadas y complementarias (PRZ).
- Evalúa la acción del precio en el pasado y muestra todos los patrones anteriores (opción).
- El indicador analiza su propia calidad y rendimiento
- Muestra los niveles adecuados de stop-loss y take-profit
- Utiliza las rupturas para señalar las operaciones adecuadas
- Traza todos los ratios del patrón en el gráfico
- Implementa mensaje de alerta/notificación de aplicación/telegrama
- Espera una ruptura de Donchian en la dirección correcta antes de señalar el comercio
- O espera un patrón inverso de vela japonesa
Modo de empleo (parámetro de configuración):
- -1 no se usa
- >0 se usa y el valor es la tolerancia de D, ej: [0.382-tolerancia]BA<BC<[0.382+tolerancia]BA
ABCD Tasa de AC/BD (1 es perfecto: AB=CD. Por defecto es 1,5(BD<=AC<1,5*BD). -1 no se utiliza)
- En rango es el patrón escaneado en el rango mínimo y máximo de la tabla de tasas.
- Exactamente es el nivel exacto de fibonancia
XABCD Scan (Tolerancia del nivel de fibonancia (>0). Por defecto:0): añade Tolerancia al rango min,max. Esta opción debe usarse cuando la tasa de fibonancia XABCD está dentro del rango.
...
Barra máxima desde D hasta el punto de inversión. Por defecto es 10: de D a 10 velas después debe tener señal de resever Canal de Donchian o vela japonesa.
Leyenda del patrón de la vela:
//bullish
CANDLE_PATTERN_THREE_WHITE_SOLDIERS -> "c3ws" (tres solitarios blancos)
CANDLE_PATTERN_PIERCING_LINE -> "cpl"
CANDLE_PATTERN_MORNING_DOJI -> "cmd"
CANDLE_PATTERN_BULLISH_ENGULFING -> "cbeare"
CANDLE_PATTERN_BULLISH_HARAMI -> "cbullh"
CANDLE_PATTERN_MORNING_STAR -> "cms"
CANDLE_PATTERN_BULLISH_MEETING_LINES -> "cbullml"
CANDLE_PATTERN_HAMMER -> "chammer"
//bearish
CANDLE_PATTERN_THREE_BLACK_CROWS -> "c3bc"
CANDLE_PATTERN_DARK_CLOUD_COVER -> "cdcc"
CANDLE_PATTERN_EVENING_DOJI -> "ced"
CANDLE_PATTERN_BEARISH_ENGULFING -> "cbulle"
CANDLE_PATTERN_BEARISH_HARAMI -> "cbearh"
CANDLE_PATTERN_EVENING_STAR -> "ces"
CANDLE_PATTERN_BEARISH_MEETING_LINES -> "cbearml"
CANDLE_PATTERN_HANGING_MAN -> "colgando"