Harmonic plus Zup Patterns with reveser confirm

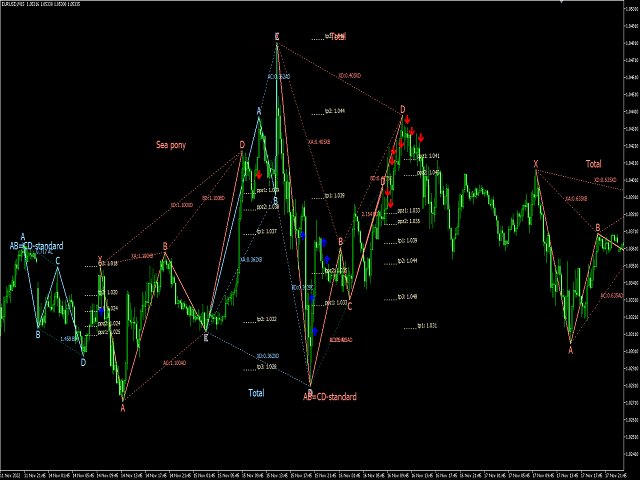
The concept of Harmonic Patterns was established by H.M. Gartley in 1932. Harmonic Patterns create by 4 peak (ABCD) or 5 peak (XABCD). In traditional, we have BAT pattern, Gartley pattern, butterfly pattern, crab pattern, deep crab pattern, shark pattern. Each pattern has its own set of fibonacci. In this indicator, we add more extended pattern named ZUP pattern. So we have total 37 pattern as follow

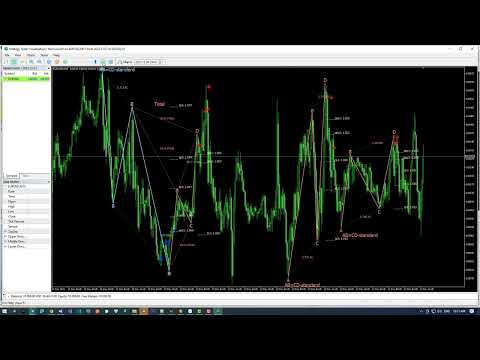
This indicator detects all above patterns, takes fibonacci projections as seriously as you do, displays the Potential Reversal Zone (PRZ) and finds suitable stop-loss and take-profit levels.

  • It detects 19 different harmonic price formations
  • It plots primary, derived and complementary Fibonacci projections (PRZ)
  • It evaluates past price action and displays every past pattern (option)
  • The indicator analyzes its own quality and performance
  • It displays suitable stop-loss and take-profit levels
  • It uses breakouts to signal suitable trades
  • It plots all the pattern ratios on the chart
  • It implements Alert/App notification/Telegram message
This indicator has been designed to fulfill the needs of the most purist and exigent traders. However, it implements a twist to make it easier to trade and making signals very reliable 
  • It waits for a Donchian breakout in the right direction before signaling the trade
  • Or waits for Japanese Candle reverse pattern 

How to use (setup parameter):

ABCD scan is using ABCD patter or not: 
  • -1 is not use
  • >0 is use and value is tolerance of D, ex: [0.382-tolerance]BA<BC<[0.382+tolerance]BA

ABCD Rate of AC/BD (1 is perfect: AB=CD. Default is 1.5(BD<=AC<1.5*BD). -1 is not use)

XABCD fibonancy rate in range or exactly
  • In range is pattern scaned in min,max range in rate table
  • Exactly is use exact fibonanci level

XABCD Scan (Tolerance of fibonaci level (>0). Default:0): add Tolerance to min,max range. This option should use when XABCD fibonancy rate is in range.

...

Max bar from D to reversal point. Default is 10: from D to 10 candle after should have resever signal Donchian channel or Japanese candle

Legend for candle pattern:

//bullish

CANDLE_PATTERN_THREE_WHITE_SOLDIERS -> "c3ws"

CANDLE_PATTERN_PIERCING_LINE -> "cpl"

CANDLE_PATTERN_MORNING_DOJI -> "cmd"

CANDLE_PATTERN_BULLISH_ENGULFING -> "cbeare"

CANDLE_PATTERN_BULLISH_HARAMI -> "cbullh"

CANDLE_PATTERN_MORNING_STAR -> "cms"

CANDLE_PATTERN_BULLISH_MEETING_LINES -> "cbullml"

CANDLE_PATTERN_HAMMER -> "chammer"

//bearish

CANDLE_PATTERN_THREE_BLACK_CROWS -> "c3bc"

CANDLE_PATTERN_DARK_CLOUD_COVER -> "cdcc"

CANDLE_PATTERN_EVENING_DOJI -> "ced"

CANDLE_PATTERN_BEARISH_ENGULFING -> "cbulle"

CANDLE_PATTERN_BEARISH_HARAMI -> "cbearh"

CANDLE_PATTERN_EVENING_STAR -> "ces"

CANDLE_PATTERN_BEARISH_MEETING_LINES -> "cbearml"

CANDLE_PATTERN_HANGING_MAN -> "hanging"


Prodotti consigliati
AutoTrend Pro
Aram Hussein Mohammed
TL Method — Automatic Trendline Detection & Strength Indicator Tired of drawing trendlines manually? TL Method does it for you — automatically detecting, drawing, and scoring trendlines in real time. What it does: Scans up to 1000 bars to find valid support and resistance trendlines Scores each trendline by counting confirmed anchor touches Generates buy/sell signal arrows when price approaches strong trendlines Alerts you via popup, push notification, or sound — with smart cooldown to avoid spa
Trade smarter, not harder: Empower your trading with Harmonacci Patterns This is arguably the most complete harmonic price formation auto-recognition indicator you can find for the MetaTrader Platform. It detects 19 different patterns, takes fibonacci projections as seriously as you do, displays the Potential Reversal Zone (PRZ) and finds suitable stop-loss and take-profit levels. [ Installation Guide | Update Guide | Troubleshooting | FAQ | All Products  ] It detects 19 different harmonic pric
CosmiCLab SMC FIBO CosmiCLab SMC FIBO is a professional trading indicator designed for traders who use Smart Money Concepts (SMC), market structure analysis and Fibonacci retracement levels. The indicator automatically detects market swings and builds Fibonacci levels based on the latest impulse movement. It also identifies market structure changes such as BOS (Break of Structure) and CHOCH (Change of Character), helping traders understand the current market direction. CosmiCLab SMC FIBO also pr
Unlock powerful breakout opportunities The 123 Pattern is one of the most popular, powerful and flexible chart patterns. The pattern is made up of three price points: a bottom, a peak or valley, and a Fibonacci retracement between 38.2% and 71.8%. A pattern is considered valid when the price breaks beyond the last peak or valley, moment at which the indicator plots an arrow, rises an alert, and the trade can be placed. [ Installation Guide | Update Guide | Troubleshooting | FAQ | All Products  ]
"Hunttern harmonic pattern finder" base on the dynamic zigzag with the notification and prediction mode This version of the indicator identifies 11 harmonic patterns and predicts them in real-time before they are completely formed. It offers the ability to calculate the error rate of Zigzag patterns depending on a risk threshold. It moreover sends out a notification once the pattern is complete. The supported patterns: ABCD BAT ALT BAT BUTTERFLY GARTLEY CRAB DEEP CRAB CYPHER SHARK THREE DRIV
Trend Master V2
Oratile Pitsoane
What Is Trend Master Pro? Trend Master Pro   is a professional-grade trend trading indicator built for MetaTrader 5. It was designed with one goal in mind — to keep you on the right side of the market at all times by combining three powerful technical tools into a single, clean, easy-to-read display directly on your price chart. Instead of cluttering your screen with multiple separate indicators, Trend Master Pro fuses an   EMA Ribbon trend filter , a   ZigZag swing point engine , and a   breako
Представлен принципиально новый индикатор ZigZag, который отличается от стандартного абсолютной легкостью, быстродействием расчетов и очень высокой точностью. В основе индикатора заложен принцип цикличности рынка с совокупностью анализа количества текущих баров и их основных ценовых уровней. Чем меньше баров для определения расчетов, тем более агрессивная постройка линий индикатора. Как и в  стандартном индикаторе перерисовывается только последняя линия, при изменении достигнутого экстремума. П
Automated Trendlines MT5
Georgios Kalomoiropoulos
Le linee di tendenza sono lo strumento più essenziale di analisi tecnica nel forex trading. Sfortunatamente, la maggior parte dei trader non li disegna correttamente. L'indicatore automatizzato delle linee di tendenza è uno strumento professionale per i trader seri che ti aiuta a visualizzare il movimento di tendenza dei mercati. Esistono due tipi di linee di tendenza, linee di tendenza rialziste e linee di tendenza ribassiste. Nella tendenza rialzista, la linea di tendenza Forex viene tracci
RBreaker
Zhong Long Wu
RBreaker Gold Indicators is a short-term intraday trading strategy for gold futures that combines trend following and intraday reversal approaches. It not only captures profits during trending markets but also enables timely profit-taking and counter-trend trading during market reversals. This strategy has been ranked among the top ten most profitable trading strategies by the American magazine   Futures Truth   for 15 consecutive years. It boasts a long lifecycle and remains widely used and st
Scan pattern
VLADISLAV AKINDINOV
The indicator is designed to help in making a decision on the direction of trading (buy or sell). It is a history scanner that searches for matches of the current pattern (combination of several current bars) with historical data in percentage terms by the relative vertical position of candles relative to each other, the size of each candle, the size of the candle body and the candle shadows. In history, the matches found are indicated by vertical lines on the candle of the beginning of the soug
Overview The Market Perspective Structure Indicator is a comprehensive MetaTrader indicator designed to provide traders with a detailed analysis of market structure across multiple timeframes. It identifies and visualizes key price action elements, including swing highs and lows, Break of Structure (BOS), Change of Character (CHOCH), internal structures, equal highs/lows, premium/discount levels, previous levels from higher timeframes, and trading session zones. With extensive customization opt
ATrend
Zaha Feiz
4.83 (18)
"ATREND: Come funziona e come utilizzarlo" ### Come funziona L'indicatore "ATREND" per la piattaforma MT5 è progettato per fornire ai trader robusti segnali di acquisto e vendita utilizzando una combinazione di metodologie di analisi tecnica. Questo indicatore sfrutta principalmente l'Average True Range (ATR) per la misurazione della volatilità, insieme ad algoritmi di individuazione dei trend per identificare potenziali movimenti di mercato. Lascia un messaggio dopo l'acquisto e ricevi un rega
"Adjustable Fractals" - è una versione avanzata dell'indicatore frattale, uno strumento di trading molto utile! - Come sappiamo, l'indicatore MT5  Standard fractals non ha impostazioni, il che è molto scomodo per i trader. - Adjustable Fractals ha risolto questo problema, ha tutte le impostazioni necessarie: - Periodo regolabile dell'indicatore (valori consigliati: superiori a 7). - Distanza regolabile dai massimi/minimi del prezzo. - Design regolabile delle frecce frattali. - L'indicatore è do
"Pattern 123" is an indicator-a trading system built on a popular pattern, pattern 123. This is the moment when we expect a reversal on the older trend and enter the continuation of the small trend, its 3rd impulse. The indicator displays signals and markings on an open chart. You can enable/disable graphical constructions in the settings. The indicator has a built-in notification system   (email, mobile terminal, standard terminal alert). "Pattern 123" has a table that displays signals from se
PREngulfing
Slobodan Manovski
PR EA - Engulfing Pattern Trading System Automated Engulfing Pattern Detection with MA Confirmation The PR EA is a Meta Trader 5 expert advisor that identifies and trades bullish/bearish engulfing candlestick patterns when confirmed by a moving average filter. Designed for swing trading on 30-minute charts with compatibility for M15 and H1 time frames. Key Features: Pattern Recognition - Detects valid bullish/bearish engulfing candle formations Trend Confirmation - 238-period SMA filter
Candle Pattern Pro MT5
Komang Putra Riswanjaya
Description : In the world of trading, candlestick patterns are a popular technical analysis tool used by many traders.   There are numerous candlestick patterns, ranging from reversal patterns to continuation patterns. However, remembering all these patterns can be challenging, especially for novice traders. This often leads to traders having to manually memorize and identify candlestick patterns, which can be time-consuming and prone to errors. Candle Pattern Pro is a powerful indicator desig
Potential Reversal Price (PRP) Indicator - Ultimate Sniper Entries for XAUUSD Discounted   Price   !!     Secure your lifetime access   now   before it switches to   subscription-only ! Welcome to the Potential Reversal Price (PRP) Indicator , your ultimate trading tool designed to catch high-probability market reversals with extreme precision. Built for serious traders who demand accuracy, the PRP Indicator combines advanced market structure analysis with momentum exhaustion to pinpoint the exa
"GoldenSwing" is a comprehensive MetaTrader 5 indicator meticulously crafted by Southern Star Trading, designed to enhance your trading strategies with precision swing high and swing low identification. Harnessing the power of swing analysis, this indicator provides traders with invaluable insights into market reversals and trend continuations, enabling them to make informed trading decisions. With its advanced algorithm, GoldenSwing detects significant swing highs and swing lows in real-time,
Terra Infinity is a flat indicator. This improved version of the CalcFlat indicator has three additional lines that significantly increase its effectiveness. Unlike its predecessor with two static levels, Terra Infinity adds three dynamic lines above the main histogram, which are interpreted as follows: base signal line, minimum signal line, maximum signal line. These lines are formed using the additional parameter Avg, which is the average value of the histogram. Averaging produces a line cl
Chỉ báo này sẽ thông báo cho bạn nếu cấu hình xu hướng thành công. Tín hiệu theo xu hướng không nên được tăng theo, nhưng tín hiệu mua ở mức giá thấp theo mô hình giao dịch thông thường của bạn, hoặc tín hiệu bán ở mức giá tốt, là một lựa chọn rất tốt. Hãy thiết lập nó trên khung thời gian lớn hơn và theo dõi các khung thời gian nhỏ hơn, bám sát các xu hướng chính. Tôi thường thiết lập ba khung thời gian gần nhau nhất và không bao giờ đi ngược tín hiệu của INdicator này. INdicator   này không có
MercariaPattern1-2-3 відстежує рух ціни, знаходить трьоххвильові структури 1-2-3 та підсвічує момент, коли сценарій підтверджується пробоєм ключового рівня. MercariaPattern1-2-3 tracks price movement, detects three-leg 1-2-3 structures and highlights the moment when the scenario is confirmed by a key level breakout. Індикатор збирає локальні свінги в компактну фігуру 0–1–2–3 , чекає підтвердженого пробою та будує стрілку входу з готовими рівнями SL/TP. The indicator combines local swings into a
L'indicateur SMC Venom Model BPR est un outil professionnel pour les traders travaillant dans le concept Smart Money (SMC). Il identifie automatiquement deux modèles clés sur le graphique des prix: FVG   (Fair Value Gap) est une combinaison de trois bougies, dans laquelle il y a un écart entre la première et la troisième bougie. Forme une zone entre les niveaux où il n'y a pas de support de volume, ce qui conduit souvent à une correction des prix. BPR   (Balanced Price Range) est une combinaiso
Qauters Theory GBPJPY
Brighton Mufaro Mudzingwa
QT PRO Quarters Theory GBPJPY · London Open Breakout Plots 250-pip major quarters, 125-pip half-quarters, and 25-pip minor levels on GBPJPY. Monitors the London session open (08:00 GMT) and fires a single buy or sell arrow when price breaks and closes beyond the first key level — one signal per day, no repainting How it works now: Arrows only appear between 08:00–12:00 GMT (London session) — nothing outside that window 1 arrow per day maximum — once the first valid break is found, that day is
Indicatore Crypto_Forex "Hammer and Shooting Star Pattern" per MT5, senza ridisegnazione, senza ritardo. - L'indicatore "Hammer and Shooting Star Pattern" è un indicatore molto potente per il trading basato sulla Price Action. - L'indicatore rileva pattern Hammer rialzisti e Shooting Star ribassisti sul grafico: - Bullish Hammer - Segnale freccia blu sul grafico (vedi immagini). - Bearish Shooting Star - Segnale freccia rossa sul grafico (vedi immagini). - PC, Mobile alerts. - L'indicatore "Ham
My products:   https://www.mql5.com/ru/users/astra077/seller In the product line: Candlestick Pattern Detector   — a free basic version. Candlestick Patterns Standard   — a paid single-chart version with extended patterns and filters:  https://www.mql5.com/ru/market/product/174530 Japanese Candlestick Patterns Pro MT5   — a professional single-chart version with a summary table:  https://www.mql5.com/ru/market/product/173411 Multi-Currency Candlestick Pattern Scanner   — the ultimate version: a
Fibaction
Abdelkhalek Orabi
Indicator Name: Fibaction – price action candle Detector Description: Fibo Signal Boxes is a powerful Smart Money Concept (SMC)-inspired indicator that auto-detects price action candles. bullish hammers and shooting stars, then draws precise Fibonacci entry zones and multiple take-profit levels directly on the chart. as for the SL personally i use 40 pips rules  Key Features: Detects bullish hammer and shooting star reversal candles. Automatically draws Fibonacci entry and TP boxes. as
Extreme Breakout Signal is a trading strategy based on price breaking key support and resistance levels. It helps identify potential trend changes and capture new upward or downward movements. Parameter Extreme Radius : A customizable parameter that can be set differently for each timeframe Key Principles Support & Resistance : Price often reacts at these levels; a breakout may indicate a new trend. Confirmation : Use volume or other indicators to confirm breakout validity. Signal Types Buy Sig
The RSI Divergence + FVG Signal indicator combines Relative Strength Index (RSI) Divergence with Fair Value Gap (FVG) detection to generate high-probability buy and sell signals based on both momentum shifts and institutional imbalance zones. Core Features: RSI Divergence Detection : Identifies both regular and hidden bullish/bearish divergences between price and RSI. Divergences indicate potential trend reversals or continuation. FVG Zone Recognition : Detects Fair Value Gaps (imbalances caused
"Impulses and Corrections 5" is created to help traders navigate the market situation. The indicator shows multi-time frame upward and downward "Impulses" of price movements. These impulses are the basis for determining the "Base" , which is composed of zones of corrections of price movements, as well as "Potential" zones for possible scenarios of price movement. Up and down impulses are determined based on a modified formula of Bill Williams' "Fractals" indicator. The last impulse is always "U
Phantom Edge SMC
Nattapon Chuekamhod
Phantom Edge SMC — The Ultimate Smart Money Indicator for MT5 Tired of manually drawing structures while trading SMC or ICT concepts? Let Phantom Edge SMC do the heavy lifting for you. Key Features Internal & Swing Structure: Automatically detects BOS and CHoCH across two structural levels. Order Blocks (OB): Identifies Internal and Swing OBs with automated mitigation tracking. Equal Highs / Lows: Highlights EQH / EQL to pinpoint Liquidity pools. Fair Value Gaps (FVG): Displays FVGs with
Gli utenti di questo prodotto hanno anche acquistato
Neuro Poseidon MT5
Daria Rezueva
4.95 (19)
Neuro Poseidon is a new indicator by Daria Rezueva. It combines precise trading signals with adaptive TP/SL levels - creating best possible trades as a result! Message me and get  Neuro Poseidon Assistant  as a gift to automize your trading process! What makes it stand out? 1. Proven profitability on all assets and timeframes 2. Only confirmed BUY and SELL signals present on the chart 3. Adaptive TP & SL levels generated by the software for each trade 4. Easy to understand - suitable for al
PrimeScalping
Temirlan Kdyrkhan
PrimeScalping is a powerful trading companion designed to generate high-probability entry signals with dynamic TP/SL/DP levels based on volatility. Built-in performance tracking shows win/loss stats, PP1/PP2 hits, and success rates — all updated live. Key Features: Buy/Sell signals with adaptive volatility bands Real-time TP/SL/DP levels based on ATR Built-in MA Filter with optional ATR/StdDev volatility Performance stats panel (Success, Profit/Loss, PP1/PP2) Alerts via popup, sound, push, or e
Divergence Bomber
Ihor Otkydach
4.9 (90)
Ogni acquirente dell’indicatore riceverà inoltre gratuitamente: L’utilità esclusiva “Bomber Utility”, che gestisce automaticamente ogni operazione, imposta i livelli di Stop Loss e Take Profit e chiude le posizioni secondo le regole della strategia I file di configurazione (set file) per adattare l’indicatore a diversi asset I set file per configurare il Bomber Utility in tre modalità: “Rischio Minimo”, “Rischio Bilanciato” e “Strategia di Attesa” Una guida video passo-passo per installare, conf
SignalTech MT5 is an unique fully rule based trading system for EURUSD, USDCHF, USDJPY, AUDUSD, NZDUSD, EURJPY, AUDJPY, NZDJPY, CADJPY.  All the winning trades with chart setups are published on the comments page. 2026-05 4107 Pips (Until 05-29 NY Closed) 2026-04 2243 Pips 2026-03 2165 Pips 2026-02 2937 Pips 2026-01 2624 Pips 2025-12 1174 Pips It can generate signals with Buy/Sell Arrows and Pop-Up/Sound Alerts. Each signal has clear Entry and Stop Loss levels, which should be automatically flag
Presentazione       Quantum Breakout PRO   , l'innovativo indicatore MQL5 che sta trasformando il modo in cui scambi le zone di breakout! Sviluppato da un team di trader esperti con un'esperienza di trading di oltre 13 anni,       Quantum Breakout PRO       è progettato per spingere il tuo viaggio di trading a nuovi livelli con la sua strategia innovativa e dinamica della zona di breakout. Quantum Breakout Indicator ti fornirà frecce di segnalazione sulle zone di breakout con 5 zone target di
Azimuth Pro
Ottaviano De Cicco
5 (7)
Azimuth Pro V2: Synthetic Fractal Structure and Confirmed Entries for MT5 Overview Azimuth Pro is a multi-level swing structure indicator by Merkava Labs . Four nested swing layers, swing-anchored VWAP, ABC pattern detection, three-timeframe structural filtering, and closed-bar confirmed entries — one chart, one workflow from micro-swings to macro-cycles. This is not a blind signal product. It is a structure-first workflow for traders who care about location, context, and timing. V2 Launch Offe
Quantum TrendPulse
Bogdan Ion Puscasu
5 (25)
Ecco   Quantum TrendPulse   , lo strumento di trading definitivo che combina la potenza di   SuperTrend   ,   RSI   e   Stocastico   in un unico indicatore completo per massimizzare il tuo potenziale di trading. Progettato per i trader che cercano precisione ed efficienza, questo indicatore ti aiuta a identificare con sicurezza le tendenze di mercato, i cambiamenti di momentum e i punti di entrata e uscita ottimali. Caratteristiche principali: Integrazione SuperTrend:   segui facilmente l'andame
Questo prodotto è stato aggiornato per il mercato 2026 e ottimizzato per le ultime build di MT5. AVVISO DI AGGIORNAMENTO PREZZO: Smart Price Action Concepts è attualmente disponibile a $200 . Il prezzo aumenterà a $299 dopo i prossimi 30 acquisti . OFFERTA SPECIALE: Dopo l’acquisto, inviami un messaggio privato per ricevere un bonus gratuito + regalo . Prima di tutto, vale la pena sottolineare che questo strumento di trading è un indicatore non-repainting, non-redrawing e non-lagging, il che lo
RelicusRoad Pro MT5
Relicus LLC
4.96 (24)
RelicusRoad Pro: Sistema Operativo Quantitativo di Mercato 70% DI SCONTO ACCESSO A VITA (TEMPO LIMITATO) - UNISCITI A 2.000+ TRADER Perché la maggior parte dei trader fallisce anche con indicatori "perfetti"? Perché operano su Singoli Concetti isolati. Un segnale senza contesto è una scommessa. Per vincere serve CONFLUENZA . RelicusRoad Pro non è un semplice indicatore. È un Ecosistema Quantitativo completo . Mappa la "Fair Value Road", distinguendo tra rumore e rotture strutturali. Smetti di in
ARIPoint
Temirlan Kdyrkhan
1 (1)
ARIPoint is a powerful trading companion designed to generate high-probability entry signals with dynamic TP/SL/DP levels based on volatility. Built-in performance tracking shows win/loss stats, PP1/PP2 hits, and success rates all updated live. Key Features: Buy/Sell signals with adaptive volatility bands Real-time TP/SL/DP levels based on ATR Built-in MA Filter with optional ATR/StdDev volatility Performance stats panel (Success, Profit/Loss, PP1/PP2) Alerts via popup, sound, push, or email Cu
Meta Trend PRO MT5
Roman Podpora
5 (1)
META TREND PRO       — è uno strumento di trend following che elimina le incertezze dal trading e mostra dove il mercato ha già preso la sua decisione. L'indicatore identifica i punti chiave in cui cambiano trend, tendenze e strutture, ed evidenzia le aree in cui il prezzo ritorna, consentendo ai principali operatori di prendere posizione. Non solo visualizzi il movimento, ma ne comprendi anche la logica sottostante. Tutti i segnali vengono registrati dopo la chiusura della candela, non vengono
Versione Swing M30/H1/H4 disponibile Vuoi catturare i grandi movimenti? Gold Signal Swing Pro (M30/H1/H4). Obiettivo: $20-$80+ per trade. https://www.mql5.com/en/market/product/177643 KURAMA GOLD SIGNAL PRO (MT5) — Sistema di Trading XAUUSD Completo a 7 Strati di Filtri Nessun repaint. Nessun ridisegno. Nessun ritardo. Ogni segnale rimane fissato una volta confermato. Bonus acquirente: Chiunque acquisti la licenza di acquisto riceve AI Zone Radar (v
Meridian Pro
Ottaviano De Cicco
5 (2)
Meridian Pro 2.00: Professional Multi-Timeframe Trend Matrix for MT5 Meridian Pro 2.00 is a professional adaptive trend matrix for MetaTrader 5. It combines the original Meridian trend engine, a clean chart ribbon, closed-bar signal arrows, an 8-timeframe dashboard, Fuel momentum, weighted consensus, synthetic HTF processing and chart-native higher-timeframe context lines. The goal is simple: read current trend, multi-timeframe structure, strength, momentum and EA-ready state from one discipline
M1 Quantum è un sistema di trading professionale per M1 che fornisce segnali di trading rapidi e precisi con Stop Loss, Take Profit e gestione intelligente del capitale integrati. M1 Quantum include un sistema professionale di gestione del capitale progettato per far crescere rapidamente il conto concentrandosi su vittorie consecutive . Caratteristiche principali dell' Indicatore M1 Quantum Progettato per il time frame M1 e tutte le principali coppie di valute Tutti i trade hanno Stop Loss e Tak
MetaForecast M5
Vahidreza Heidar Gholami
5 (3)
MetaForecast predice e visualizza il futuro di qualsiasi mercato basandosi sull'armonia dei dati dei prezzi. Sebbene il mercato non sia sempre prevedibile, se esiste un modello nei prezzi, MetaForecast può prevedere il futuro con la massima precisione possibile. Rispetto ad altri prodotti simili, MetaForecast può generare risultati più accurati analizzando le tendenze di mercato. Parametri di input Past size (Dimensione passata) Specifica il numero di barre che MetaForecast utilizza per creare
Meravith MT5
Ivan Stefanov
5 (1)
Strumento per market maker. Meravith: Analizzerà tutti i timeframe e mostrerà il trend attualmente in corso. Evidenzierà le zone di liquidità (equilibrio dei volumi) dove i volumi rialzisti e ribassisti sono uguali. Mostrerà tutti i livelli di liquidità dei diversi timeframe direttamente sul grafico. Genererà e presenterà un’analisi di mercato testuale a scopo di riferimento. Calcolerà obiettivi, livelli di supporto e punti di stop-loss in base al trend attuale. Calcolerà il rapporto rischio/ren
KT Alpha Hunter Arrows MT5
KEENBASE SOFTWARE SOLUTIONS
La maggior parte degli indicatori a frecce ti dà un segnale e poi ti lascia capire da solo tutto il resto. KT Alpha Hunter Arrows ti offre un piano di trading completo. Ogni freccia di segnale appare con un piano completo già disegnato: linea di ingresso, stop loss, quattro livelli di take profit e un verdetto live sull’edge, che ti indica se quel simbolo e quel timeframe meritano davvero di essere tradati in quel momento. Il Trade Manager EA incluso gestisce l’esecuzione dopo il tuo ingresso, c
PZ Swing Trading MT5
PZ TRADING SLU
5 (5)
Protect against whipsaws: revolutionize your swing trading approach Swing Trading is the first indicator designed to detect swings in the direction of the trend and possible reversal swings. It uses the baseline swing trading approach, widely described in trading literature. The indicator studies several price and time vectors to track the aggregate trend direction and detects situations in which the market is oversold or overbought and ready to correct. [ Installation Guide | Update Guide | Tro
Btmm state engine pro
Garry James Goodchild
5 (5)
BTMM State Engine Pro is a MetaTrader 5 indicator for traders who use the Beat The Market Maker approach: Asian session context, kill zone timing, level progression, peak formation detection, and a multi-pair scanner from a single chart. It combines cycle state logic with a built-in scanner dashboard so you do not need the same tool on many charts at once. What it does Draws the Asian session range; session times can follow broker server offset or be set in inputs. Tracks level progression (L
Contattami dopo l'acquisto per ricevere l'EA basato su questo indicatore gratuitamente come bonus. ChandraSAR Optimizer: Il motore quantitativo di trend auto-adattivo La maggior parte degli indicatori di trend fallisce per una semplice ragione: i mercati cambiano, ma i parametri statici no. ChandraSAR Optimizer colma il divario tra la semplice generazione di segnali e il testing algoritmico avanzato. È un sistema dinamico di trend-following per MetaTrader 5 che risolve il problema dei cambiamen
L'indicatore UZFX {SSS} Scalping Smart Signals MT5 è un indicatore di trading ad alte prestazioni che non si aggiorna (non repaint) progettato per scalper, day trader e swing trader che necessitano di segnali accurati e in tempo reale in mercati in rapida evoluzione. Sviluppato da (UZFX-LABS), questo indicatore combina l'analisi dell'andamento dei prezzi, la conferma del trend e un filtraggio intelligente per generare segnali di acquisto e vendita ad alta probabilità su tutte le coppie di valute
Rilevatore intelligente multistrato di breakout e pullback per MetaTrader 5 "Intelligente. Semplice. Veloce!" Sei stanco di perdere entrate su breakout ad alta probabilità? Passi ore a scansionare più grafici, cercando di allineare i breakout con la direzione del trend e il momentum delle valute — solo per perdere il movimento? Break Pullback risolve tutto questo con un solo indicatore. Cos'è Break Pullback? Break Pullback è un indicatore MetaTrader 5 di livello professionale, progettato speci
Current event:  https://c.mql5.com/1/326/A2SR2025_NoMusic.gif A2SR per MT5 Indicatore: Domanda e Offerta Effettive Automatizzate (S/R). + Strumenti di Trading. Product description in English here. --   Guidance   : -- at   https://www.mql5.com/en/blogs/post/734748/page4#comment_16532516 -- and  https://www.mql5.com/en/users/yohana/blog Potente, Autentico e Risparmio di Tempo per Decisioni di Trading più Intelligenti + Oggetti compatibili con EA. Vantaggi Principali Livelli di SR Effettivi
CRT Multi-Timeframe Market Structure & Liquidity Sweep Indicator Non-Repainting | Multi-Asset | MT4 Version Available MT4 Version: https://www.mql5.com/en/market/product/162556 Full Setup Guide: https://www.mql5.com/en/blogs/post/767525 Indicator Overview CRT Ghost Candle HTF Fractal is a complete institutional-grade market structure toolkit for MetaTrader 5. It projects higher-timeframe candle structure, CRT trap levels, session levels, previous period highs and lows, pivot points, and a real
ARICoins
Temirlan Kdyrkhan
ARICoin is a powerful trading companion designed to generate high-probability entry signals with dynamic TP/SL/DP levels based on volatility. Built-in performance tracking shows win/loss stats, PP1/PP2 hits, and success rates all updated live. Key Features: Buy/Sell signals with adaptive volatility bands Real-time TP/SL/DP levels based on ATR Built-in MA Filter with optional ATR/StdDev volatility Performance stats panel (Success, Profit/Loss, PP1/PP2) Alerts via popup, sound, push, or email Cust
Trend Forecaster
Alexey Minkov
5 (7)
Trend Forecaster – Since 2023. The Trend Forecaster indicator utilizes a unique proprietary algorithm to determine entry points for a breakout trading strategy. The indicator identifies price clusters, analyzes price movement near levels, and provides a signal when the price breaks through a level. The Trend Forecaster indicator is suitable for all financial assets, including currencies (Forex), metals, stocks, indices, and cryptocurrencies. You can also adjust the indicator to work on any time
ICT PO3 (Power of 3) AMD Protocol Framework Indicator True Time & Structure Integration   |  Non-Repainting | Real-Time  | Multi-Asset  | MT4 Version Available Full Setup Guide & Strategy Playbook: https://www.mql5.com/en/blogs/post/768683 MT4 Version: https://www.mql5.com/en/market/product/171742 Indicator Overview The ICT PO3 AMD Protocol Framework is a complete structural overlay for MetaTrader 5 that maps the True Daily Cycle directly onto your lower-timeframe execution chart. It projects
Precision Spike Detector
Francisco Mandomo Simbine
5 (1)
Precision Spike Detector V3 – Institutional-Grade AI Trading System Attention: The price increases by US$50 for every 10 purchases.  Final price: US$599 Precision Spike Detector V3   is a   state-of-the-art, institutional-grade market analysis system   for   MetaTrader 5 , designed to detect   high-probability market movements   in synthetic indices such as   Boom, Crash, GainX, and PainX . After purchase, please contact me through the MQL5 messaging system to receive the order management tool
Weltrade Spike Sentinel
Batsirayi L Marango
5 (1)
Introducing Indicator for PainX and GainX Indices Traders on Weltrade Get ready to experience the power of trading with our indicator, specifically designed for Weltrade   broker's PainX and GainX Indices.  Advanced Strategies for Unbeatable Insights Our indicator employs sophisticated strategies to analyze market trends, pinpointing optimal entry and exit points.  Optimized for Maximum Performance To ensure optimal results, our indicator is carefully calibrated for 5-minute timeframe charts on
RFI levels PRO MT5
Roman Podpora
4 (4)
L'indicatore mostra accuratamente i punti di inversione e le zone di ritorno dei prezzi in cui il       Principali attori   . Vedi dove si formano le nuove tendenze e prendi decisioni con la massima precisione, mantenendo il controllo su ogni operazione. VERSION MT4     -    Rivela il suo massimo potenziale se combinato con l'indicatore   TREND LINES PRO Cosa mostra l'indicatore: Strutture di inversione e livelli di inversione con attivazione all'inizio di un nuovo trend. Visualizzazione dei li
Altri dall’autore
Sessions by LUX in MT5
Minh Truong Pham
5 (1)
This indicator shows when user set sessions are active and returns various tools + metrics using the closing price within active sessions as an input. Users have the option to change up to 4 session times. The indicator will increasingly lack accuracy when the chart timeframe is higher than 1 hour. Settings Sessions Enable Session: Allows to enable or disable all associated elements with a specific user set session. Session Time: Opening and closing times of the user set session in the  
This is a Forex Scalping Trading Sytem based on the Bollinger Bands.  Pairs:Major Time frame: 1M or higher. Spread max:0,0001.  Indicators (just suggestion) Bollinger bands (20, 2); ADX (14 period); RSI   (7 period ). Y ou should only trade this system between 2am to 5am EST, 8am to 12am EST and 7.30pm to 10pm EST. Do not scalp 30 minutes before a orange or red news  report and not for a hour afterwards.   Setup: is for price to move above the lower or lower Bollinger Bands, RSI raise above the
FREE
This is addition of  Effective SV squeeze momentum  that add bolliger band and Keltner channel to chart window.  Squeeze momentum introduced by “John Carter”, the squeeze indicator for MT5 represents a volatility-based tool. Regardless, we can also consider the squeeze indicator as a momentum indicator, as many traders use it to identify the direction and strength of price moves. In fact, the Tradingview  squeeze indicator shows when a financial instrument is willing to change from a trending ma
FREE
ICT Concepts
Minh Truong Pham
5 (2)
The ICT Concepts indicator regroups core concepts highlighted by trader and educator "The Inner Circle Trader" (ICT) into an all-in-one toolkit. Features include Market Structure (MSS & BOS), Order Blocks, Imbalances, Buyside/Sellside Liquidity, Displacements, ICT Killzones, and New Week/Day Opening Gaps. It’s one kind of Smart money concepts. USAGE: Please read this document  !    DETAILS Market Structure Market structure labels are constructed from price breaking a prior extreme point. T
The Breaker Blocks with Signals indicator aims to highlight a complete methodology based on breaker blocks. Breakout signals between the price and breaker blocks are highlighted and premium/discount swing levels are included to provide potential take profit/stop loss levels. This script also includes alerts for each signal highlighted.   SETTINGS   Breaker Blocks Length: Sensitivity of the detected swings used to construct breaker blocks. Higher values will return longer term break
Multiple Wicks forming at OverSold & OverBought levels create Buying and Selling Pressure. This indicator tries to capture the essence of the buy and sell pressure created by those wicks. Wick pressure shows that the trend is Exhausted. Order block should display when buying or selling pressure wick. When price go inside buy order block and up to outside order block, trader should consider a buy order. If price go inside buy order block and down to outside order block, trader should consider a s
The Inversion Fair Value Gaps (IFVG) indicator is based on the inversion FVG concept by ICT and provides support and resistance zones based on mitigated Fair Value Gaps (FVGs). Image 1   USAGE Once mitigation of an FVG occurs, we detect the zone as an "Inverted FVG". This would now be looked upon for potential support or resistance. Mitigation occurs when the price closes above or below the FVG area in the opposite direction of its bias. (Image 2) Inverted Bullish FVGs Turn into Potenti
Introduction One of the patterns in "RTM" is the "QM" pattern, also known as "Quasimodo". Its name is derived from the appearance of "Hunchback of Notre-Dame" from Victor Hugo's novel. It is a type of "Head and Shoulders" pattern.   Formation Method   Upward Trend In an upward trend, the left shoulder is formed, and the price creates a new peak higher than the left shoulder peak . After a decline, it manages to break the previous low and move upward again. We expect the price to
All about Smart Money Concepts Strategy: Market struture: internal or swing BOS, CHoCH; Orderblock; Liquity equal; Fair Value Gap with Consequent encroachment, Balanced price range; Level with Previous month, week, day level or in day level (PMH, PWH, PDH, HOD); BuySell Stops Liquidity (BSL, SSL); Liquidity Void Long Wicks; Premium and Discount; Candle pattern ... "Smart Money Concepts" ( SMC ) is a fairly new yet widely used term amongst price action traders looking to more accurately navigate
The indicator   returning pivot point based trendlines with highlighted breakouts . Trendline caculated by pivot point and other clue are ATR, Stdev.   The indicator also includes integrated alerts for  trendlines  breakouts   and foward message to Telegram channel or group if you want. Settings ·            Lookback bar: Default 200 is number of bar caculate when init indicator. ·            Length:  Pivot points  period ·            Slope Calculation Method: Determines how this lope is calcula
This all-in-one indicator displays real-time market structure (internal & swing BOS / CHoCH), order blocks, premium & discount zones, equal highs & lows, and much more...allowing traders to automatically mark up their charts with widely used price action methodologies. Following the release of our Fair Value Gap script, we received numerous requests from our community to release more features in the same category. //------------------------------------// Version 1.x has missing functions + PDAr
The Breaker Blocks with Signals indicator aims to highlight a complete methodology based on breaker blocks. Breakout signals between the price and breaker blocks are highlighted and premium/discount swing levels are included to provide potential take profit/stop loss levels. This script also includes alerts for each signal highlighted.   SETTINGS   Breaker Blocks Length: Sensitivity of the detected swings used to construct breaker blocks. Higher values will return longer term break
The ICT Concepts indicator regroups core concepts highlighted by trader and educator "The Inner Circle Trader" (ICT) into an all-in-one toolkit. Features include Market Structure (MSS & BOS), Order Blocks, Imbalances, Buyside/Sellside Liquidity, Displacements, ICT Killzones, and New Week/Day Opening Gaps. It’s one kind of Smart money concepts.   USAGE:   Please read this   document  !      DETAILS Market Structure Market structure labels are constructed from price breaking a prior extreme
The FollowLine indicator is a trend following indicator. The blue/red lines are activated when the price closes above the upper Bollinger band or below the lower one. Once the trigger of the trend direction is made, the FollowLine will be placed at High or Low (depending of the trend). An ATR filter can be selected to place the line at a more distance level than the normal mode settled at candles Highs/Lows. Some features: + Trend detech + Reversal signal + Alert teminar / mobile app
The ICT Silver Bullet indicator is inspired from the lectures of "The Inner Circle Trader" (ICT) and highlights the Silver Bullet (SB) window which is a specific 1-hour interval where a Fair Value Gap (FVG) pattern can be formed. A detail document about ICT Silver Bullet here . There are 3 different Silver Bullet windows (New York local time): The London Open Silver Bullet (3 AM — 4 AM ~ 03:00 — 04:00) The AM Session Silver Bullet (10 AM — 11 AM ~ 10:00 — 11:00) The PM Session Silver Bullet (2
Sessions by Lux
Minh Truong Pham
This indicator shows when user set sessions are active and returns various tools + metrics using the closing price within active sessions as an input. Users have the option to change up to 4 session times. The indicator will increasingly lack accuracy when the chart timeframe is higher than 1 hour. Settings Sessions Enable Session: Allows to enable or disable all associated elements with a specific user set session. Session Time: Opening and closing times of the user set session in the  
The liquidity swings indicator highlights swing areas with existent trading activity. The number of times price revisited a swing area is highlighted by a zone delimiting the swing areas. Additionally, the accumulated volume within swing areas is highlighted by labels on the chart. An option to filter out swing areas with volume/counts not reaching a user-set threshold is also included. This indicator by its very nature is not real-time and is meant for descriptive analysis alongside other com
The SuperTrend AI indicator is a novel take on bridging the gap between the K-means clustering machine learning method & technical indicators. In this case, we apply K-Means clustering to the famous SuperTrend indicator.   USAGE Users can interpret the SuperTrend AI trailing stop similarly to the regular SuperTrend indicator. Using higher minimum/maximum factors will return longer-term signals. (image 1) The displayed performance metrics displayed on each signal allow for a deeper interpretat
OVERVIEW A Lorentzian Distance Classifier (LDC) is a Machine Learning classification algorithm capable of categorizing historical data from a multi-dimensional feature space. This indicator demonstrates how Lorentzian Classification can also be used to predict the direction of future price movements when used as the distance metric for a novel implementation of an Approximate Nearest Neighbors (ANN) algorithm. This indicator provide signal as buffer, so very easy for create EA from this indi
This script automatically calculates and updates ICT's daily IPDA look back time intervals and their respective discount / equilibrium / premium, so you don't have to :) IPDA stands for Interbank Price Delivery Algorithm. Said algorithm appears to be referencing the past 20, 40, and 60 days intervals as points of reference to define ranges and related PD arrays. Intraday traders can find most value in the 20 Day Look Back box, by observing imbalances and points of interest. Longer term traders c
An Implied Fair Value Gap (IFVG) is a three candles imbalance formation conceptualized by ICT that is based on detecting a larger candle body & then measuring the average between the two adjacent candle shadows. This indicator automatically detects this imbalance formation on your charts and can be extended by a user set number of bars. The IFVG average can also be extended until a new respective IFVG is detected, serving as a support/resistance line. Alerts for the detection of bullish/be
Consolidation is when price is moving inside a clear trading range. When prices are consolidated it shows the market maker placing orders on both sides of the market. This is mainly due to manipulate the un informed money. This indicator automatically identifies consolidation zones and plots them on the chart. The method of determining consolidation zones is based on pivot points and ATR, ensuring precise identification. The indicator also sends alert notifications to users when a new consolida
This indicator presents an alternative approach to identify Market Structure. The logic used is derived from learning material created by   DaveTeaches (on X) Upgrade v1.10: add option to put protected high/low value to buffer (figure 11, 12) When quantifying Market Structure, it is common to use fractal highs and lows to identify "significant" swing pivots. When price closes through these pivots, we may identify a Market Structure Shift (MSS) for reversals or a Break of Structure (BOS) for co
This indicator provides the ability to recognize the SMC pattern, essentially a condensed version of the Wyckoff model. Once the pattern is confirmed by RTO, it represents a significant investment opportunity.    There are numerous indicators related to SMC beyond the market, but this is the first indicator to leverage patterns to identify specific actions of BigBoy to  navigate the market. Upgrade 2024-03-08: Add TP by RR feature. The SMC (Smart Money Concept)   pattern   is a market analysis m
Created by imjesstwoone and mickey1984, this trade model attempts to capture the expansion from the 10:00-14:00 EST 4h candle using just 3 simple steps. All of the information presented in this description has been outlined by its creators, all I did was translate it to MQL4. All core settings of the trade model may be edited so that users can test several variations, however this description will cover its default, intended behavior using NQ 5m as an example. Step 1 is to identify our Price Ra
The Buyside & Sellside Liquidity indicator aims to detect & highlight the first and arguably most important concept within the ICT trading methodology,   Liquidity   levels. SETTINGS Liquidity Levels Detection Length: Lookback period Margin: Sets margin/sensitivity for a liquidity level detection Liquidity Zones Buyside Liquidity Zones: Enables display of the buyside liquidity zones. Margin: Sets margin/sensitivity for the liquidity zone boundaries. Color: Color option for buysid
The   Liquidation Estimates (Real-Time)   experimental indicator attempts to highlight real-time long and short liquidations on all timeframes. Here with liquidations, we refer to the process of forcibly closing a trader's position in the market. By analyzing liquidation data, traders can gauge market sentiment, identify potential support and resistance levels, identify potential trend reversals, and make informed decisions about entry and exit points. USAGE (Img 1)    Liquidation refers
The   ICT Unicorn Model   indicator highlights the presence of "unicorn" patterns on the user's chart which is derived from the lectures of   "The Inner Circle Trader" (ICT) . Detected patterns are followed by targets with a distance controlled by the user.   USAGE (image 2) At its core, the ICT Unicorn Model relies on two popular concepts, Fair Value Gaps and Breaker Blocks. This combination highlights a future area of support/resistance. A   Bullish Unicorn Pattern   consists out of:
Overview The   Volume SuperTrend AI   is an advanced technical indicator used to predict trends in price movements by utilizing a combination of traditional SuperTrend calculation and AI techniques, particularly the k-nearest neighbors (KNN) algorithm. The Volume SuperTrend AI is designed to provide traders with insights into potential market trends, using both volume-weighted moving averages (VWMA) and the k-nearest neighbors (KNN) algorithm. By combining these approaches, the indicator
OVERVIEW K-means is a clustering algorithm commonly used in machine learning to group data points into distinct clusters based on their similarities. While K-means is not typically used directly for identifying support and resistance levels in financial markets, it can serve as a tool in a broader analysis approach. Support and resistance levels are price levels in financial markets where the price tends to react or reverse. Support is a level where the price tends to stop falling and m
Filtro:
Nessuna recensione
Rispondi alla recensione