MACD Deviate
- Indicadores
- Versión: 1.0
- Activaciones: 8

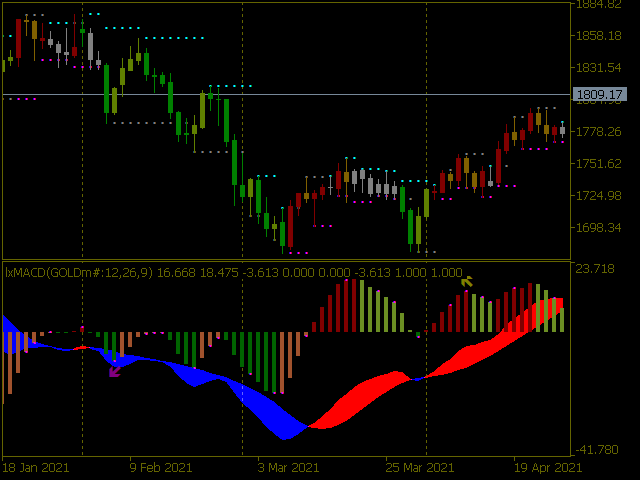
Desviación al alza
Desviación a la baja
¿Qué es la convergencia/divergencia de medias móviles (MACD)?
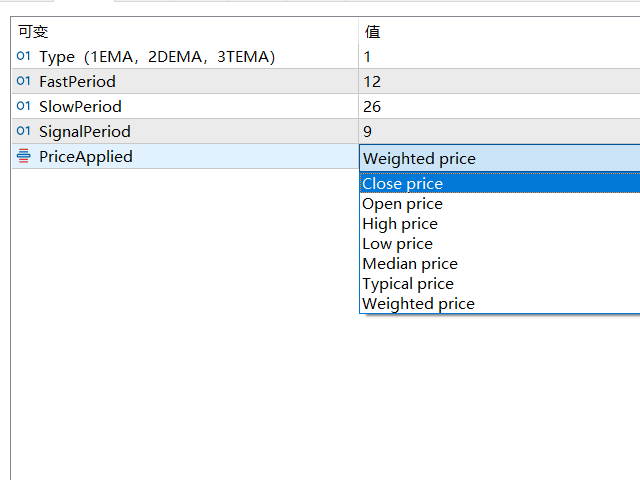
La convergencia/divergencia de medias móviles (MACD, o MAC-D) es un indicador de impulsode seguimiento de tendencia que muestra la relación entre dosmedias móviles exponenciales (EMA) del precio de unvalor. La línea MACD se calcula restando la EMA de 26 periodos de la EMA de 12 periodos.
El resultado de ese cálculo es la línea MACD. La EMA de nueve días de la línea MACD se denomina línea de señal, que se traza encima de la línea MACD y que puede funcionar como desencadenante de señales de compra o venta. Los operadores pueden comprar el valor cuando la línea MACD cruza por encima de la línea de señal y vender -o vender en corto- el valor cuando la línea MACD cruza por debajo de la línea de señal. Los indicadores MACD pueden interpretarse de varias maneras, pero los métodos más comunes son loscruces, lasdivergencias y las subidas/bajadas rápidas.