UDWay
- Indicadores
- Versión: 3.1
- Activaciones: 10

K-Line Pole Orbit UD
Parámetros de entrada
InpMyMagic: Número de fantasmas
InpShowPanel: Mostrar o no el panel
InpOneLot: Cantidad de orden abierta 1 copia [max 99.99] (=0 lote min, >0 lote fijo, <0>=-1 ratio de pérdida neta, <-1 ratio de pérdida min de balance neto)
InpAllLot: Volumen total neto de órdenes,100%(=0 lotes mínimos, >0 lotes fijos, <0>=-1 ratio de pérdidas netas, <-1 ratio de pérdidas mínimas de saldo neto)
InpLotMaxMoney: Importe máximo calculado para la cantidad de la orden abierta (=0 independientemente, >0 sobre el valor se limita a ese valor, <0 sobre el valor entero se limita a un múltiplo decimal)
InpLot1Dot1Money: Valor de la variación de la cantidad al abrir un único cambio de 1 lote de 1 punto. (<=0 calculado automáticamente (USD), >0 especificado)
InpDotBig: Valor del punto de intervalo grande (>=0 valor del punto, <1 diferencia media de tres puntos, <0 relación media entera)
InpDotSml: Valor de punto de intervalo pequeño (>=0 valor de punto, <1 diferencia media de tres dígitos, <0 relación media entera)
========== UD ==========
InpUDType: Tipo (=0 no abierto, =1 regular, =4 polarizado, =6 plataforma, =8 seguimiento lento, =10 rebasamiento, =12 seguimiento)
InpMinWidth: Anchura mínima superior e inferior de la vía (>=0 valor puntual, <1 diferencia media de tres dígitos, <0 relación media entera)
InpHTurnThr: Umbral de giro horizontal en tiempo de andén (6)
InpOffPerMaxThr: Interfaz (4) valor de la relación de desviación de la vía modificable en el momento del funcionamiento.
========== Integrado ==========
InpDirMainOp1: línea 1 de manipulación de la tendencia principal (0 no ajustada, 1 cerca de cero, 2 cerca de la relación de vía)
InpDirMainOp2: línea de manipulación de tendencia principal 2 (=0 no ajustada, >0 ratio polar de sesgo, <1 media de dispersión de tres dígitos, <0 ratio media entera)
InpDMOp2SLC: Precio Inicial de Stop Loss de MainOp2 (0~3, 1 recomendado)
InpJGPerThr: Ratio de seguimiento cercano utilizado cuando los umbrales de ratio de sesgo
InpJGPerBack: El valor del retroceso del ratio de sesgo fuera de control en el momento del ratio de seguimiento cercano
InpIsUseMoreTF: Utilización o no de ciclos múltiples
========== K desnudo ==========
InpZtMa: Valor medio global
InpStMa: Valor medio de la entidad
InpDcMa: Media del diferencial
========== EA ==========
InpIndPeriodS: Selección de combinación multiperiodo (0 todo, 1 menos 246, 2 menos otra vez, 3 menos siguiente, 8M1H1, 9 sólo M1)
InpIsCreatInd: Si el programa crea o no un indicador
InpMinTestMoney: valor neto por debajo del cual se detiene la prueba
InpMaxTestTime: Tiempo máximo de prueba (segundos)
InpIndStartK: Índice del periodo de inicio (0~max-1)
InpIndEndK: Índice de fin de ciclo (0~máx-1)
InpEAType: Tipo de EA
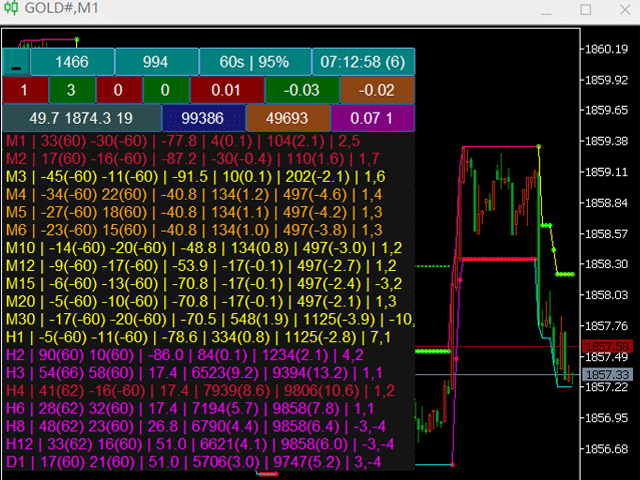
Panel
Abre el panel cuando el parámetro "InpShowPanel" está en "true".
row1: Balance Valor Neto Single K Segundos | Usado Ratio Horas Server Time
row2: Long Short Long Profit Short Profit Long Position Short Position Net Position
row3: Promedio del ciclo actual Promedio del ciclo máximo Número de ciclos múltiples Pips perdibles para la posición mínima Pips perdibles para la posición actual Posición neta máxima dentro del ratio de riesgo especificado Cantidad en dólares para un cambio de 1 pip en 1 lote
row4~max: Habilitar validez de ciclos múltiples
Ciclo | Giro de la señal 2 (Indicación de la señal 2) Giro de la señal 1 (Indicación de la señal 1) | Ratio de sesgo ② Valor del punto de precio abierto (Ratio media entera) | ② Valor del punto inverso (Ratio media entera) | ② Multinivel, ② Nivel corto
Búferes y gráficos
op1Buffer(①marker): 1 señal
op1Color: No.1 color de la señal.
op1OpenFlag(①Bandera Abierta): No.1 señal indicación largo/corto.
op1OFTurn(①turn): 1 señal larga/corta valor de giro.
op2Buffer (② marca): No. 2 señal también se utiliza como un stop-loss precios
op2Color: Color de la señal nº 2
op2OpenFlag (② posición abierta): Instrucciones largas y cortas de la señal nº 2
op2OFTurn (② giro): Nº 2 señal valores de giro largos y cortos
op2AuxSLDot (② valor de contrapunto): No. 2 valores de punto de referencia de stop-loss de la señal
op2AuxOpenPrice (② precio de apertura): precio de activación de la señal nº 2
op2AuxBLevel (② multinivel): Señal nº 2 cuando el número de niveles largos consecutivos.
op2AuxSLevel(②Short Level): Nivel de la 2ª señal cuando la señal es continuamente corta
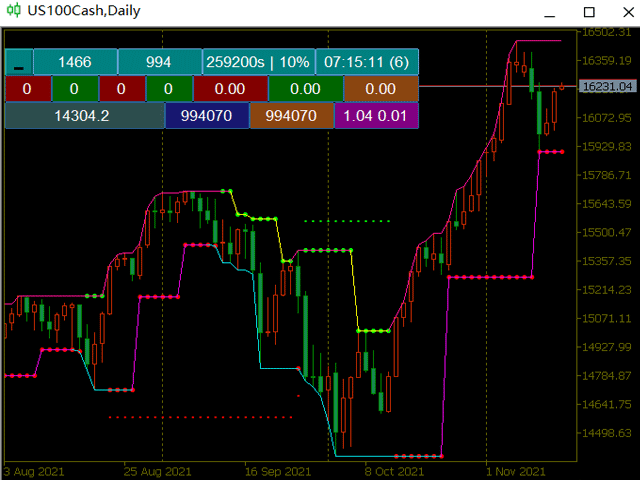
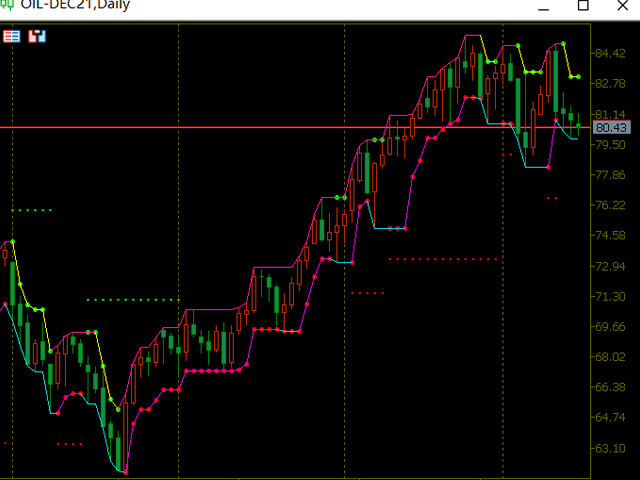
upBuffer(UD pista superior): precio de la pista superior
downBuffer(UD pista inferior): precio de la pista inferior
upColor: color de la pista superior
downColor: color de la pista inferior
upTurn(giro pista superior UD): valor del giro largo/corto de la pista superior
downTurn(Giro de la vía inferior UD): valor del giro largo/corto de la vía inferior
udDir(UD dirección): dirección larga/corta
upFloatPrice(UD上浮价):上轨道阻力价格
downFloatPrice(UD precio flotante inferior): precio de soporte de la pista inferior.
upWaveDot(distancia de la onda ascendente): la onda ascendente continua del carril superior de los valores del punto entero
upHighDiff(up antes del máximo): el carril superior de la diferencia entre el máximo de la onda actual y el valor máximo de la onda anterior
upLowDiff(upLow): la diferencia entre el mínimo de la onda actual y el mínimo de la onda anterior del carril superior.
upBackPerCurr(upBackPerCurr): el porcentaje actual de retroceso en la onda actual de la vía superior
upBackPerCurrMax(upBackPerCurrMax): el carril superior de esta onda en el porcentaje máximo de retroceso
upBackPerLast(upBackPerLastRatio): el porcentaje del retroceso actual del carril superior con la onda anterior
upBackPerLastMax(upBackPerLastMax): porcentaje de retroceso máximo de la banda superior con la onda anterior
downWaveDot(dn WaveDistance): Valor puntual de las ondas enteras consecutivas ascendentes de la banda inferior.
downHighDiff(dn previous high): la diferencia entre el máximo de la onda actual y el máximo de la onda anterior en el carril inferior
downLowDiff(dn previous low): Diferencia entre el mínimo de la onda actual y el mínimo de la onda anterior del carril inferior.
downBackPerCurr(dnBackPerCurr): porcentaje actual de retroceso en la onda actual de la tendencia bajista
downBackPerCurrMax(dn回本比Max):downBackPerCurrMax(dn回本比Max):downBackPerCurrMax(dn回本比Max):downBackPerCurrMax
downBackPerLast(dnBackPerLastRatio): la banda inferior y el porcentaje de retroceso actual de la onda anterior
downBackPerLastMax(dn回前比Max):carril inferior con el porcentaje de retroceso máximo de la onda anterior
upHCount(up水平数): El número de plataformas cuando la banda superior está en la misma dirección.
upHorizontal0(up nivel 0): el número de andenes en la misma dirección que el raíl superior.
upHorizontal1(up level 1): el número de K puros de un solo nivel en la vía superior
upHorizontal2(up level 2): el número de niveles K completos puros de la vía superior
upReverse(upReverse): precio de soporte resistencia de la vía superior
upRevDot(upRevDot): riel superior valor del punto de retroceso de esta plataforma
upBackPer(upBackPer): upBackPerCentage del retroceso de esta plataforma
upBackPerMax(upBackPerMAX): porcentaje máximo de retroceso del carril ascendente de la plataforma
downHCount(dn Conteo Horizontal): El número de andenes en la misma dirección en el carril inferior.
downHorizontal0(dn nivel 0): carril inferior con la dirección del número de andén
downHorizontal1(dn nivel 1): número de K horizontales puros en el carril inferior
downHorizontal2(dn nivel 2): el número de K horizontales puras completas en la vía inferior
downReverse(dn precio contador): precio de resistencia de soporte de la pista inferior
downRevDot(dnReverse): carril inferior valor del punto de retroceso de esta plataforma
downBackPer(dnBackPer): downBackPerCentage del retroceso de la plataforma
downBackPerMax(dnBackPerMAX): bajada del porcentaje máximo de retroceso de esta plataforma
udVWidth(Ancho Vertical): El margen entre los carriles superior e inferior.
udOffPer (porcentaje de sesgo): precio actual en el ancho actual del porcentaje de sesgo medio
udOffPerMax (ratio de sesgo superior): precio más alto en el ancho anterior del porcentaje de sesgo medio
udOffPerMin (udOffPerMin): porcentaje de sesgo del precio más bajo en el punto medio de la anchura anterior.
useTimePer: Porcentaje de tiempo consumido para esta barra K.
ztAllBuffer: Se utiliza para guardar todo el
ztDotBuffer(Overall): Valor de la diferencia de puntos entre el precio máximo y mínimo de la barra K.
ztMaBuffer(whole average): Valor medio del spread global dentro de un número especificado de barras.
ztMaPer (ratio media entera): el ratio global y medio de la columna K actual.
stAllBuffer: se utiliza para guardar todas las entidades
stDotBuffer(Entidad): valor del spread entre los precios de apertura y cierre de la barra K
stMaBuffer (media real): número especificado de barras dentro del valor medio del spread puntual de la entidad
stMaPer (relación media real): la entidad actual de la barra K a la relación media
dcAllBuffer: se utiliza para guardar toda la diferencia de puntos
dcBuffer (spread): K-bar bid-ask spread entre el valor de pips
dcMaBuffer(Average Spread): El valor medio del spread dentro del número de barras especificado.
dcMaPer (ratio del promedio del spread de puntos): el spread de puntos actual de la columna K y el ratio del valor promedio
iBuffer (índice): todas las columnas K cargadas en la columna K actual pertenecen al índice
yyBuffer (yin y yang): la barra K actual es negativa o positiva
syDotBuffer(sombra superior): el valor del punto de sombra superior de la barra K actual.
xyDotBuffer(sombra inferior): El valor del punto de sombra inferior de la barra K actual