SwingZZ MT5 with not redraw
- Indicadores
-
Minh Truong Pham
 Hello, my name is Pham and I am a programmer and trader! At here, I create amazing forex indicators and expert advisors for Metatrader.
I will try:
+ Provide best tools base on my 5 years experience as a trader and 10 years as a programmer. - Versión: 1.0
- Activaciones: 6
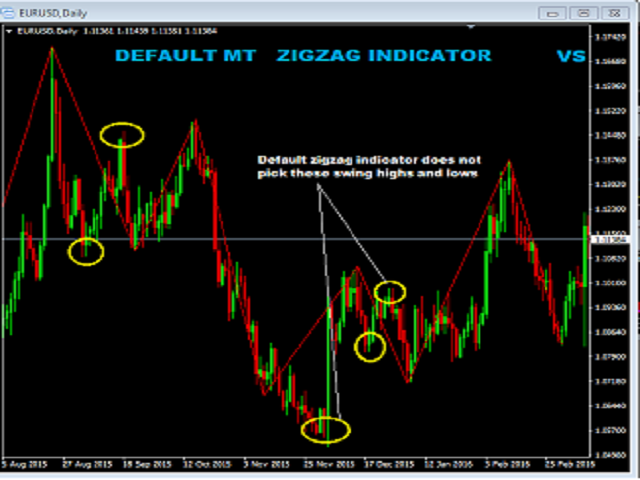
Aquí está el problema: el indicador de zigzag por defecto dado en la plataforma MT5 no captura realmente la mayoría de los máximos y mínimos en el gráfico para dibujar zigzags. En el gráfico de abajo, observe que algunos de los máximos y mínimos del precio no han sido captados para dibujar zigzags por este indicador de zigzag por defecto (imagen 1).
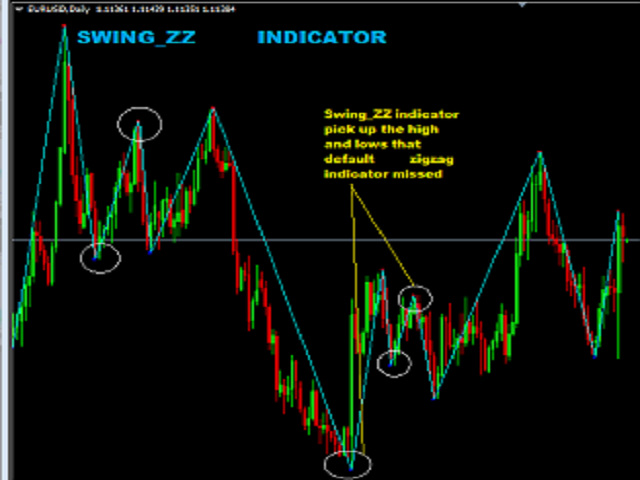
No es tan evidente hasta que se compara el indicador de zigzag por defecto con este indicador SwingZZ. Eche un vistazo a las imágenes 2 y 3.
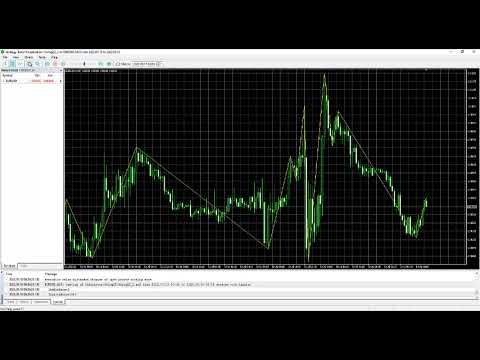
El indicador swing zigzag es el mejor porque captura la mayoría de los máximos y mínimos de la acción del precio para dibujar zigzags. Cuando construí este indicador, me referí al indicador Onix SwingZZ en MT4 pero este se redibuja en cada tick. Por lo tanto, cambio todo a sólo redibujar el tercer extremum de la última barra no completada (al igual que el indicador MetaQuotes Zigzag hizo)
Y con estos zigzags, usted puede:
+ usar para dibujar lineas de tendencia, dibujar canales
+ identificar niveles de soporte y resistencia
+ incluso identificar patrones gráficos como el patrón de cabeza y hombros
+ utilizar para colocar stoploss, takeprofit...
Como puede ver, hay un puñado de cosas que puede hacer con este indicador zigzag forex.
CÓMO AJUSTAR LA CONFIGURACIÓN DEL INDICADOR SWING ZIGZAG MT4 PARA OBTENER MÁS PRECISIÓN
Lo que me gusta del indicador swing zigzag es que se puede ajustar la configuración para obtener más precisión.
He aquí cómo ajustar la configuración:
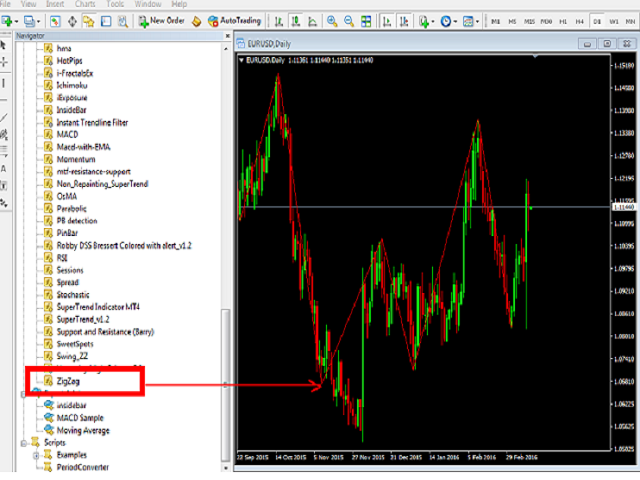
1. Haga clic derecho en su gráfico donde el indicador swing zigzag ha sido cargado y haga clic en "lista de indicadores" y esto abrirá una ventana con una lista de todos los indicadores que tiene en ese gráfico.
2. 2. Busque Swing_ZZ y haga doble clic en él para abrir la segunda ventana.
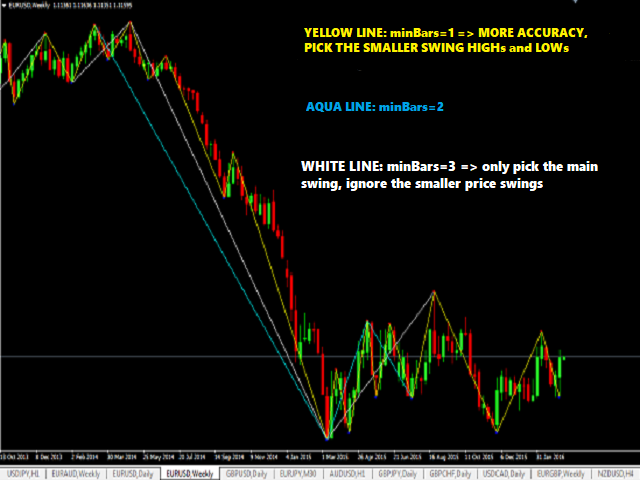
3. En la segunda ventana, por defecto, en la pestaña "inputs", el "minBars" está fijado en 2. Cambiando este número a 1, obtendrá más precisión. Aumentando este número a 3 o 4, la precisión disminuye porque sólo elegirá aquellos máximos y mínimos de oscilación significativos para dibujar zigzags.
4. 4. A continuación, haga clic en "Aceptar" y se cerrará la segunda ventana, entonces sólo le queda la primera bobinadora y haga clic en "Cerrar".
Comparemos algunos gráficos para ver como cambia la precisión cuando cambias el "minBars" (imagen 4)