ADX by AV
- Indikatoren
- Version: 1.10
- Aktualisiert: 6 Juni 2020

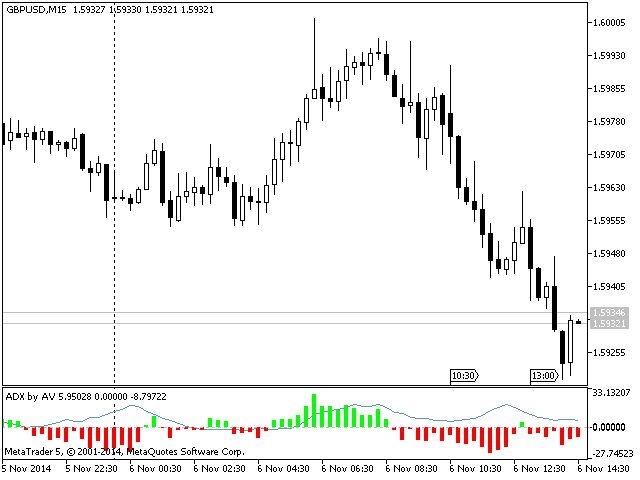
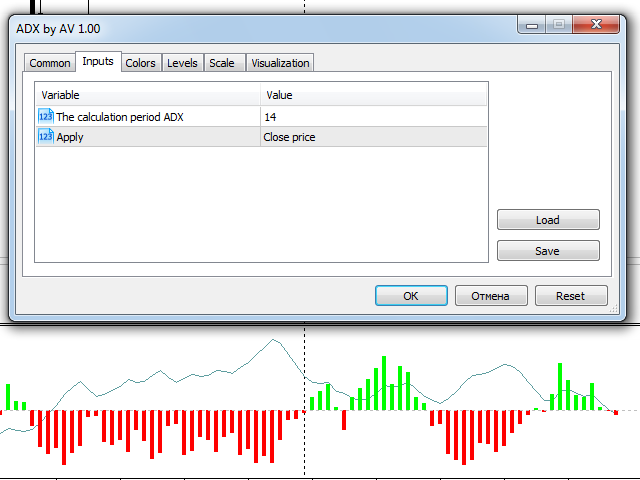
Dies ist eine ungewöhnliche Darstellung des Average Directional Movement Index. Der Indikator wurde auf Wunsch eines Händlers und zum Zweck des Lernens der Entwicklung von Indikatoren in MQL5 entwickelt.
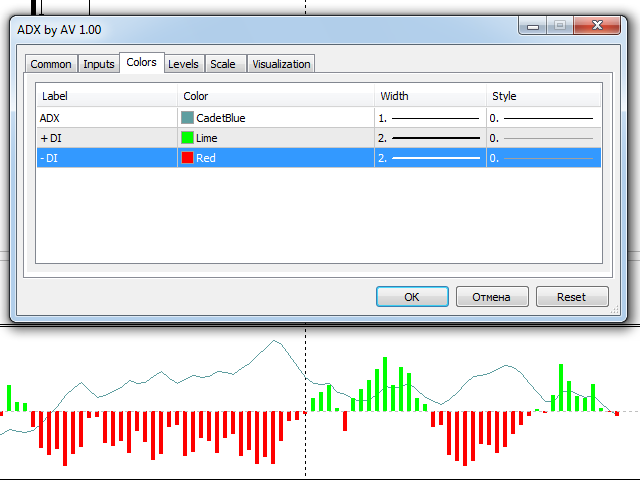
- Die Linie zeigt dasselbe wie der Standard Average Directional Movement Index (ADX);
- Das Aufwärtshistogramm zeigt die Differenz zwischen +DI und -DI, wenn +DI über -DI liegt;
- Das Abwärtshistogramm zeigt den Unterschied zwischen +DI und -DI, wenn +DI unter -DI liegt.


GOOD