KeltnerTRBands
-
Indicadores
-
-
Versión:
1.10
-
Activaciones:
5
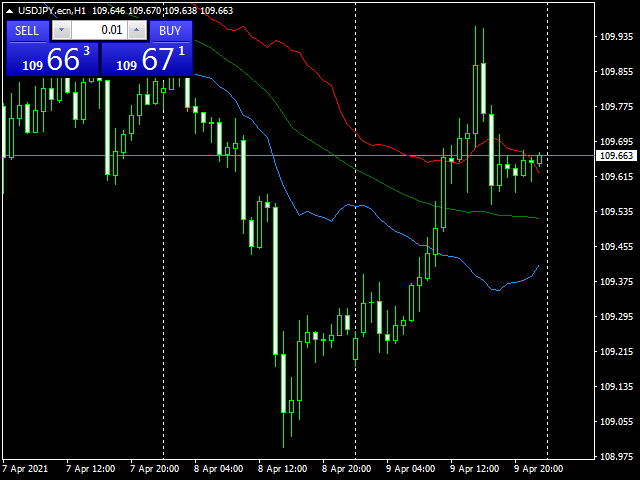
Los canales de Keltner son bandas basadas en la volatilidad que se colocan a ambos lados del precio de un activo y pueden ayudar a determinar la dirección de una tendencia. La media móvil exponencial (EMA) de un canal de Keltner suele ser de 20 periodos, aunque puede ajustarse si se desea (por defecto es de 50).
En los canales clásicos de Keltner, las bandas superior e inferior se fijan normalmente dos veces el rango medio verdadero (ATR) por encima y por debajo de la EMA, aunque el multiplicador también se puede ajustar en función de las preferencias personales. Pero en este indicador, las Bandas calculadas con sólo True Range, Significa una especie de sistema de ruptura de rango.
El precio que alcanza la banda superior del Canal de Keltner es alcista, mientras que si alcanza la banda inferior es bajista. El ángulo del Canal de Keltner también ayuda a identificar la dirección de la tendencia.
Usted puede cambiar las bandas medias períodos ema y true range bar count seperatly.