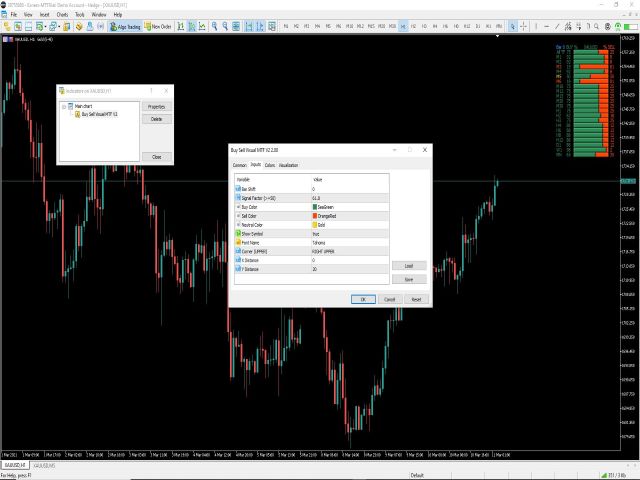
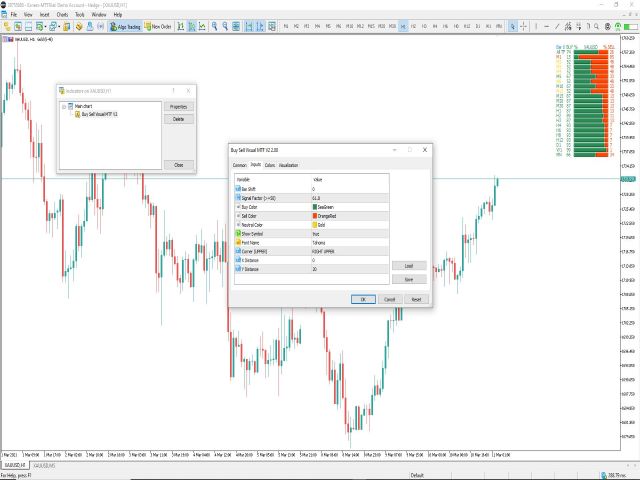
Buy Sell Visual MTF V2 for MT5
- Indicadores
-
Naththapach Thanakulchayanan
 Gracias, gracias, gracias, estoy bien.
 - Versión: 2.2
- Actualizado: 12 marzo 2021
- Activaciones: 5
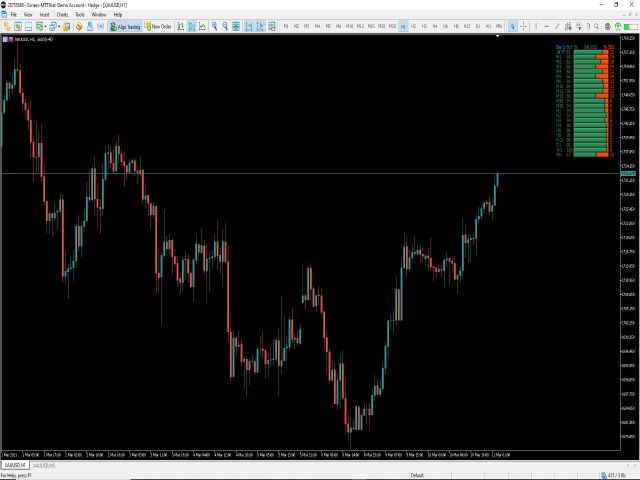
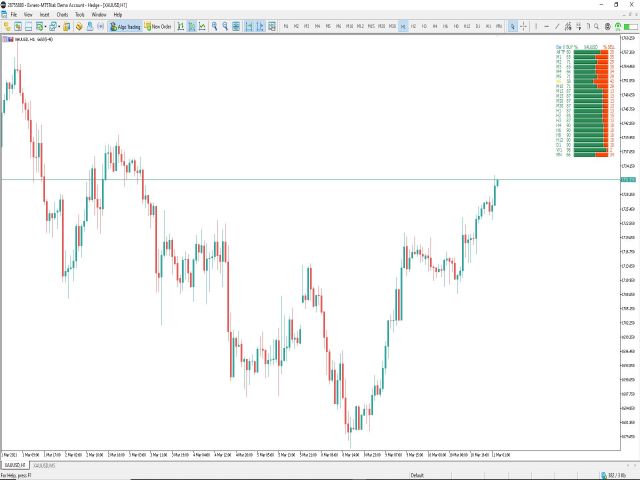
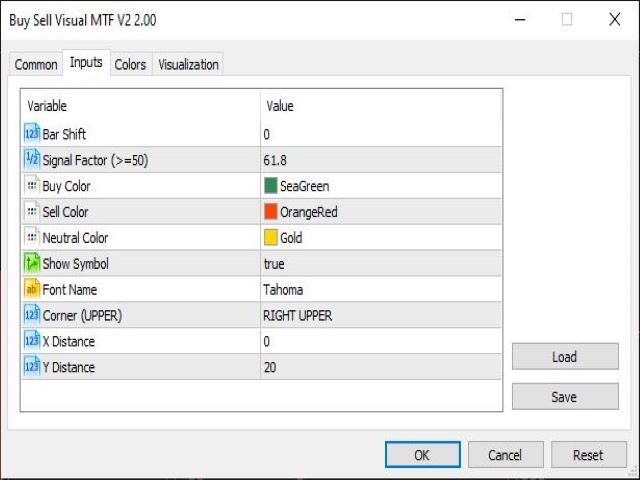
Este indicador MT5, Bull Bear Visual MTF V2, resumir el gráfico de color de la fuerza y los porcentajes de poder tanto para Bull y Bear en la etapa actual emoción del mercado que le mostrará en múltiples marcos de tiempo (21) y la suma de la fuerza total de Bull y Bear poder que es una información importante para los comerciantes sobre todo se puede ver todo el poder de Bull y Bear en gráfico visualizado fácilmente, espero que sea una herramienta útil para usted para tomar una buena decisión en el comercio.