Volume Bars
- Indicadores
- Versión: 1.0
- Activaciones: 5
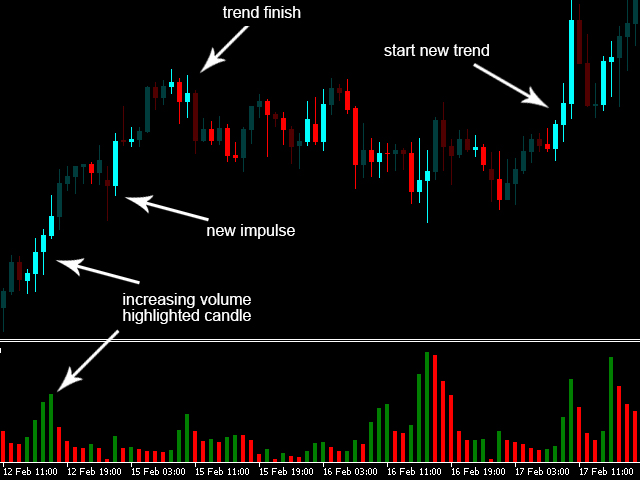
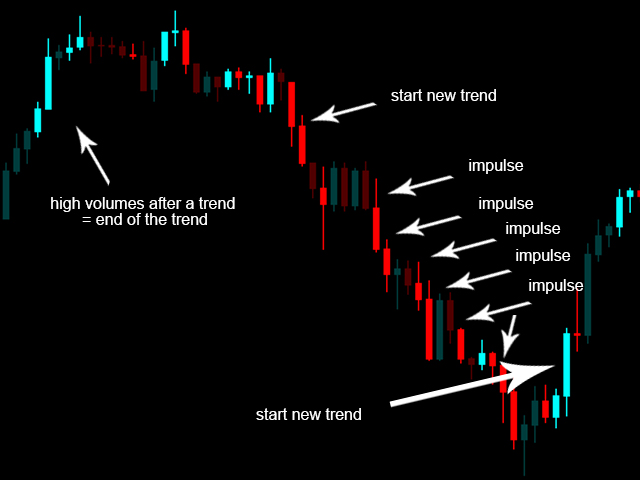
Un indicador eficaz que destaca las velas con volúmenes crecientes, eclipsando aquellas con volúmenes decrecientes.
También es adecuado para Forex porque utiliza tick_volume.
Puede configurar los colores a su gusto.
Será más fácil detectar tendencias y posibles retrocesos. Los volúmenes crecientes indican la presencia de grandes inversores y, por tanto, determinan la fiabilidad de la vela en observación