Trailing Uses StdDev
- Indicadores
- Versión: 1.0
- Activaciones: 5
Trailing Utiliza la desviación estándar.
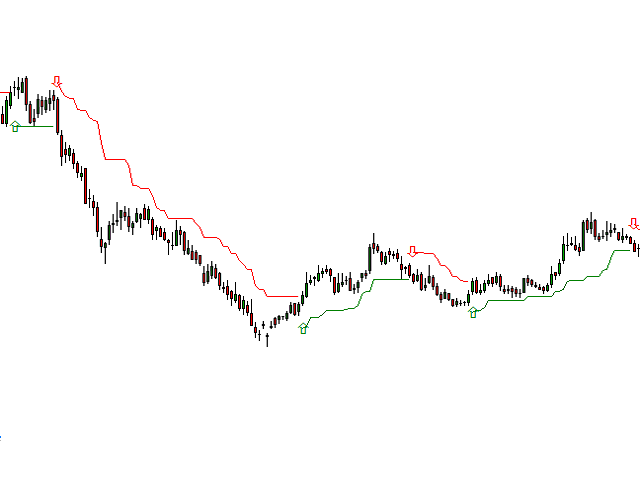
Adaptive_Trailing_uses_StdDev_Indicator es un indicador de movimiento direccional que permite identificar una tendencia en el momento de su inicio y establecer los niveles de un stop de protección.
A diferencia del trailing con una distancia constante, el indicador utiliza la distancia al precio proporcional a la desviación estándar actual de StdDev. La distancia es igual al producto de la desviación típica y el coeficiente constante fijado por el usuario.
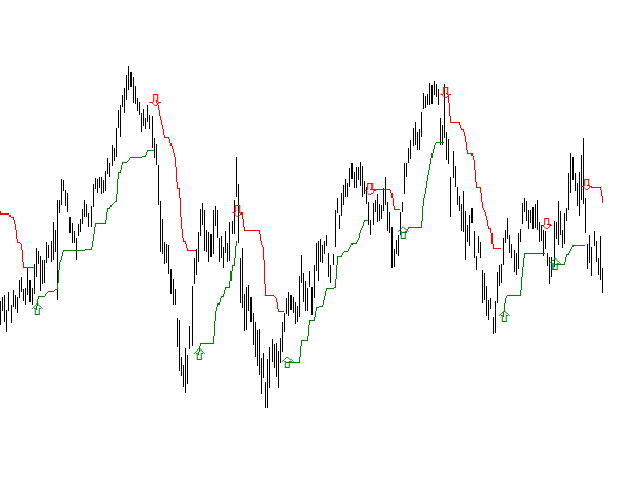
De este modo, el método trailing se adapta a la volatilidad de los precios.
Los momentos de cambio de tendencia se indican con flechas.
Ventajas
- Reconocimiento estable de la tendencia desde su inicio hasta el final.
- Se percibe e interpreta fácilmente.
- Funciona en cualquier instrumento.
- Funciona en todos los plazos.
- No se redibuja ni se recuenta.
Opciones
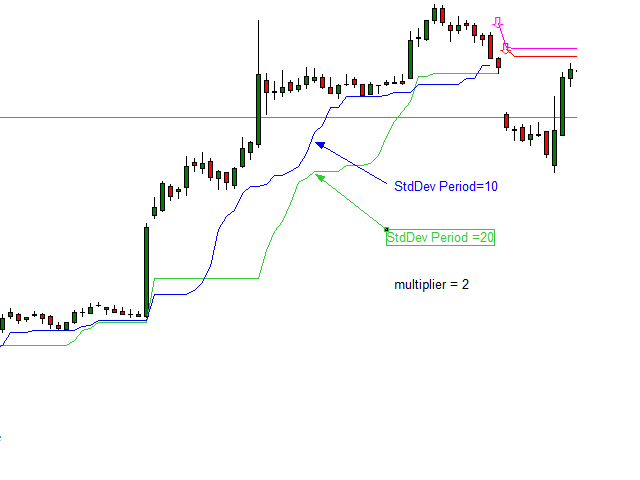
- StdDev period - periodo para calcular la desviación estándar.
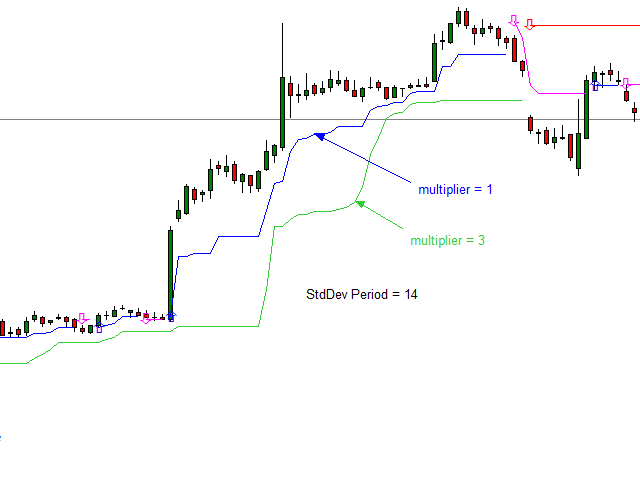
- Multiplier - coeficiente positivo para calcular la distancia.
- Shift - desplazamiento del indicador, número de barras.
Uso de
El indicador Adaptive_Trailing_uses_StdDev se puede utilizar de varias maneras.
- Como señal de una tendencia.
- Para evaluar la fuerza de la tendencia: cuando el precio supera significativamente la línea del indicador, una tendencia creciente está ganando fuerza. Si el precio se acerca a la línea del indicador, la tendencia creciente se está debilitando. Del mismo modo, se reconoce una tendencia bajista.
- Generar señales de compra/venta cuando el precio cruza la línea indicadora.
Características
- Cuanto más largo sea el período de cálculo de la desviación típica, menos a menudo el indicador señala un cambio de tendencia.
- Cuanto mayor sea el coeficiente de multiplicación, menos a menudo se producen señales.