Unique reversal zones
- Indicadores
- Versión: 1.0
- Activaciones: 5

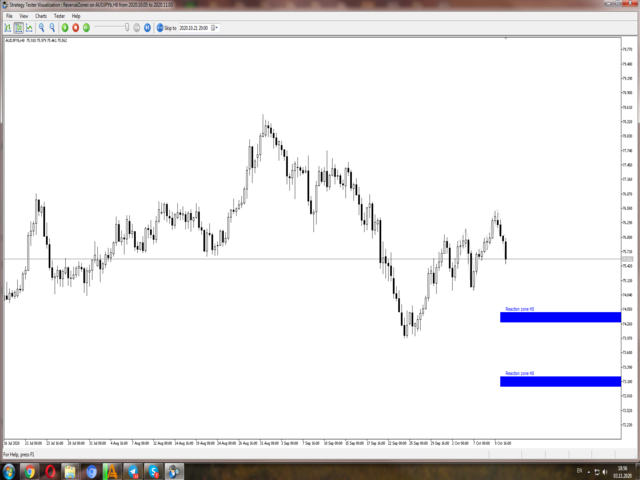
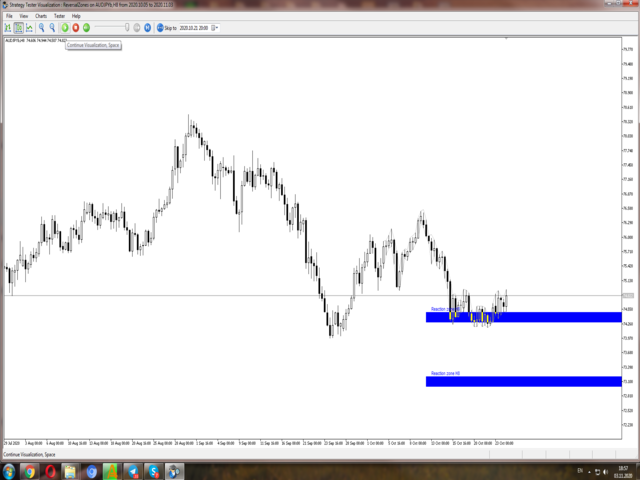
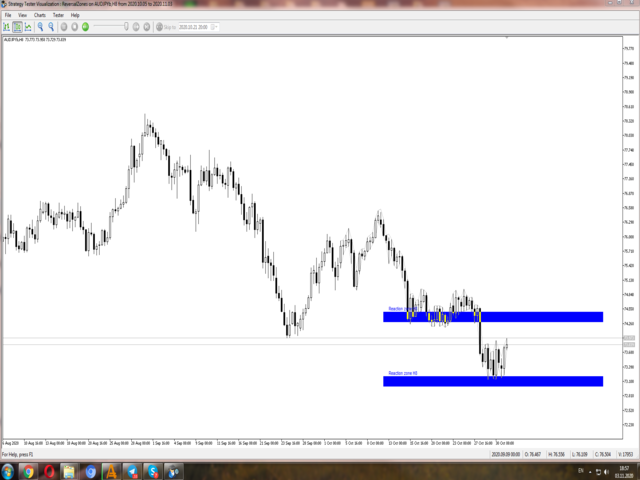
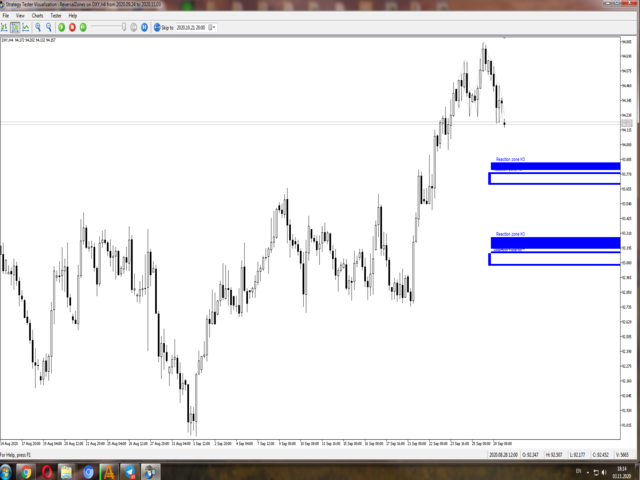
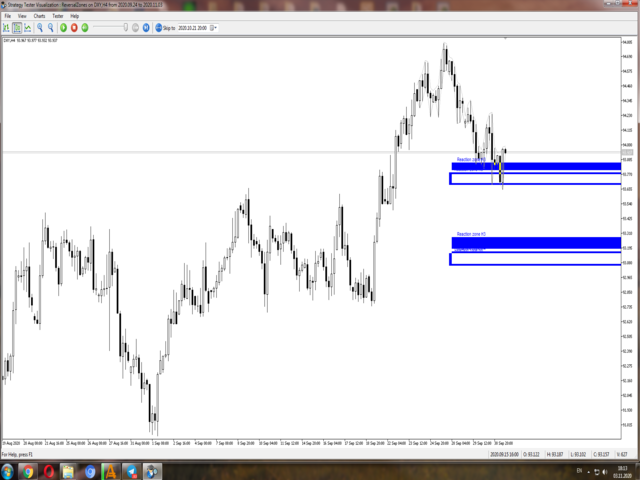
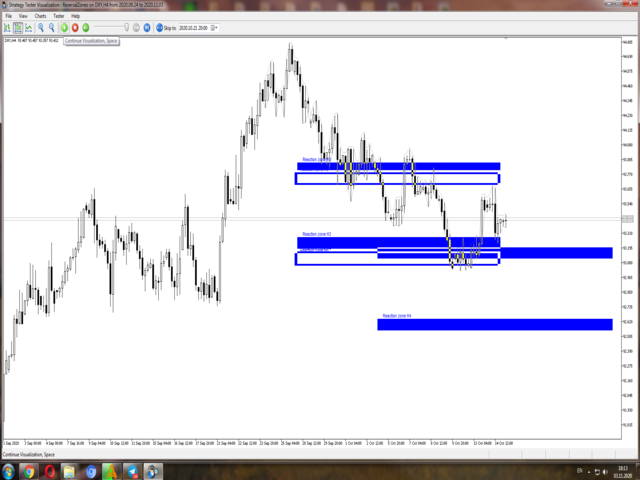
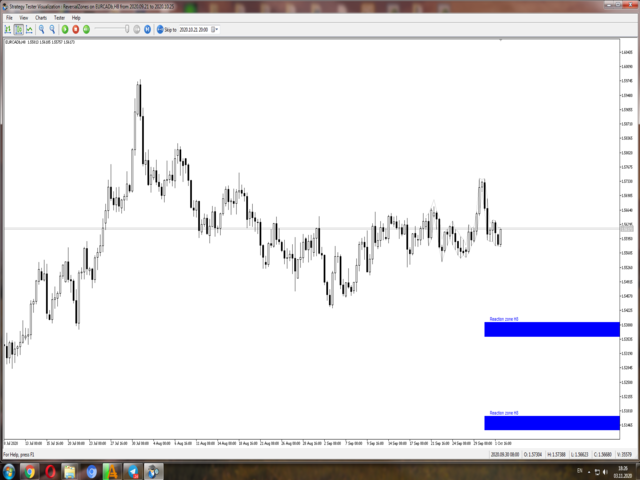
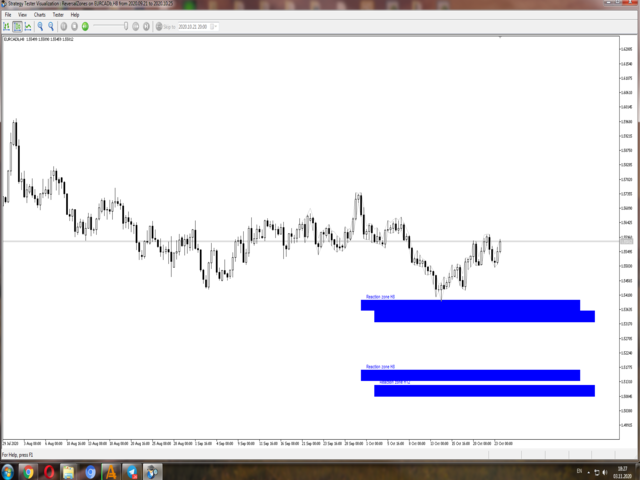
Me gustaría presentar a usted realmente ÚNICO multitimeframe y multidivisa indicador que se muestran tanto las zonas de reacción (Cuando el precio tendrá una reacción inmediata de una zona determinada) y también una zonas de inversión, lo que podría invertir el precio por un largo tiempo. La principal ventaja es que TODAS LAS ZONAS SE MOSTRAN antes de que sucedan y no después como muchos hacen (Esto se muestra muy bien en las capturas de pantalla)
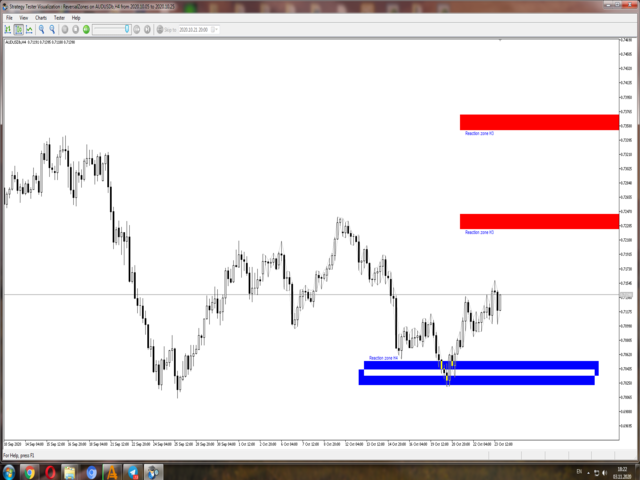
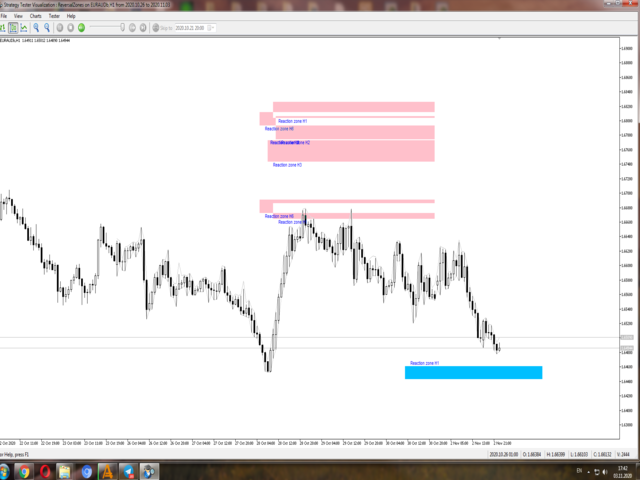
Otra razón por la que es único es que usted lo pone en 1 gráfico, por ejemplo EURUSD H1, y si hay señal en otro marco de tiempo (H2, H3 H4, H6 H8 H12 D1) no importa en cuál de ellos, usted recibirá una alerta, y luego el gráfico del marco de tiempo se abrirá automáticamente en una nueva ventana. Sucede muy a menudo cuando las zonas en varios marcos de tiempo se producen muy cerca uno del otro, que strenghthens la zona mucho y en este caso es la probabilidad de una inversión es casi 80-90%.
La gran ventaja de esto es que NO TIENE NINGÚN INDICADOR en el interior, que se construye sobre un volumen de perfiles y un fibonacci zonas. He probado las zonas de más de 10 años en un gráfico de la historia y easilly puede decir que es SIMPLEMENTE instrumento increíble.
Funciona correctamente no sólo en un par de divisas, sino también en EE.UU. Dollar Index, SP500 INDex y simplemente en cualquier instrumento que está disponible en Metatrader.¡Usted puede fácilmente tomarlo en el período de 1 mes para entender la fuerza y la estructura de trabajo y estoy seguro de que va a comprar para siempre.
También para las personas que lo compran, voy a dar varios consejos de cómo trabajar varias veces más effectivelly en él que por lo general de mi experiencia perosnal y le garantizo que si siguiendo todos los consejos, usted se sorprenderá de su resultado!