Setup DT Trap
- Indicadores
- Versión: 1.0
- Activaciones: 5

Señales de compra y venta basadas en la estrategia Day Trade Trap para rupturas fallidas, popularizada en Brasil por Alexandre Wolwacz (STORMER).
Cómo funciona el indicador?
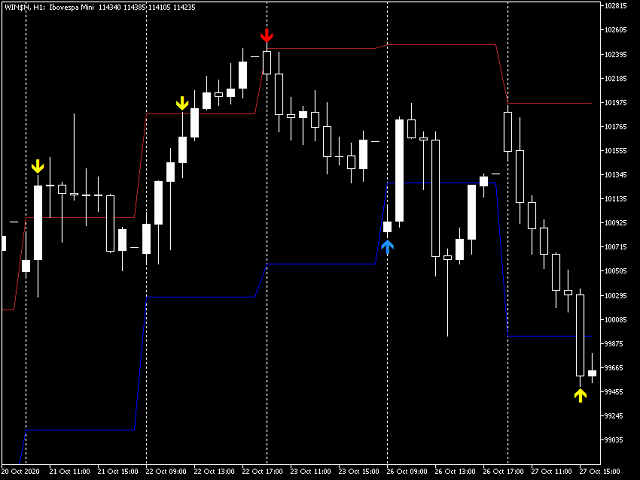
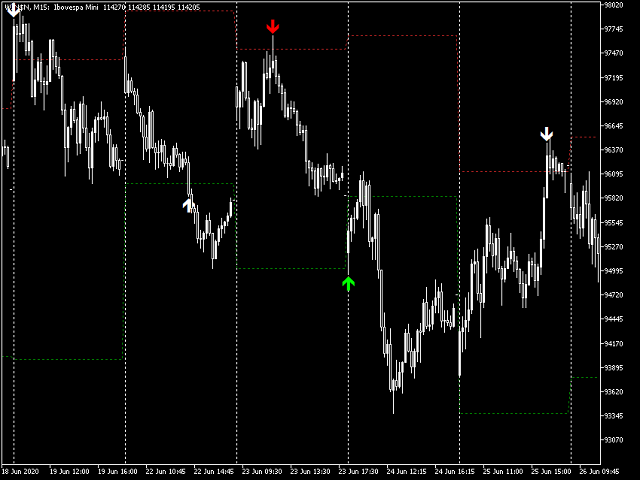
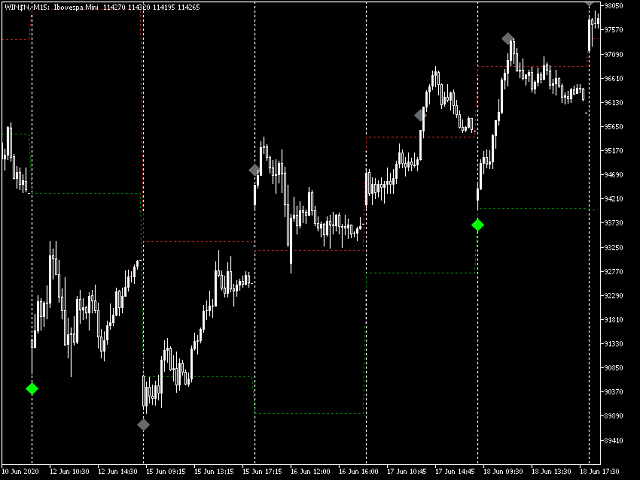
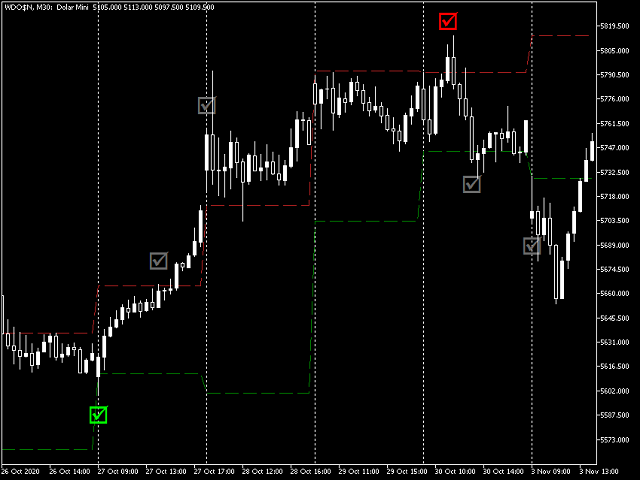
El indicador activa la señal de compra y venta cuando se cumplen sus respectivas condiciones.
Para una señal de compra, necesitamos una barra que haga un mínimo inferior al mínimo del día anterior. En este momento, la señal se traza con el color secundario.
Para una señal de venta, necesitamos una barra que haga un máximo superior al máximo del día anterior. En este momento, la señal se traza con el color secundario.
¿Cómo se utiliza?
Para una compra, necesitamos que la siguiente barra haga un máximo superior al de la barra anterior con la señal. En este momento, la señal cambia al color primario. La entrada es un tick por encima del máximo de la barra con señal. Si la entrada no se activa en la barra siguiente, debe cancelarse.
El stop loss se sitúa un tick por debajo del mínimo de la barra señalada. El objetivo es el doble del tamaño de la barra señalada, desde su máximo.
Para una venta, necesitamos que la barra siguiente haga un mínimo más bajo que la barra anterior con la señal. En este momento, la señal cambia al color primario. La entrada es un tick por debajo del mínimo de la barra con señal. Si la entrada no se activa en la barra siguiente, debe cancelarse.
El stop loss se sitúa un tick por encima del máximo de la barra señalada. El objetivo es el doble del tamaño de la barra señalada, desde su mínimo.
Consejos:
- Funciona en todos los marcos temporales inferiores al diario.
- Tenga en cuenta cuánto tiempo queda hasta el final del día y si es probable que alcance el objetivo hasta entonces.
- La señal es excelente cuando la barra es de inversión (martillo/estrella fugaz) o seguida inmediatamente por un patrón de inversión (patrón envolvente/cubierta de nubes oscuras/patrón de perforación).
- Cuanto mayor sea el volumen de la barra señalada, más fuerte tenderá a ser el movimiento.
- Si el símbolo está en sobreventa diaria, la señal de compra es mejor. Y si está Sobrecomprado Diario, la señal de venta es mejor.
- El indicador filtra el primer toque del máximo/mínimo del día anterior, no trazando señales en los toques siguientes.
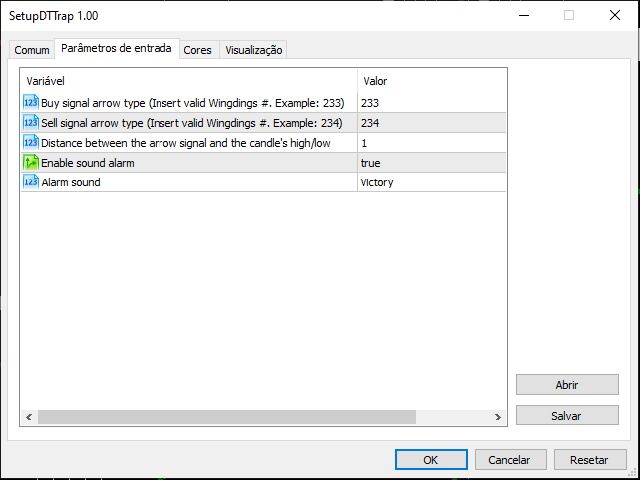
Características que puede editar a su preferencia:
- Tipo de las flechas de señal de Compra y Venta, basado en la fuente Wingdings.
- Seis opciones de distancia entre las señales de flecha y el máximo/mínimo de la vela, que se ajustan automáticamente para diferentes símbolos y marcos temporales.
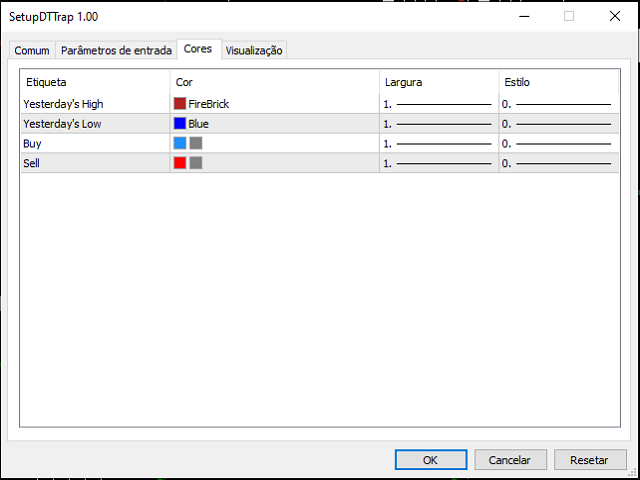
- Color y tamaño de las flechas de señal de Compra y Venta no activadas.
- Color de las flechas de señal de Compra y Venta activadas.
- Color, grosor y estilo de los máximos y mínimos del día anterior.
- Activar/desactivar la alarma sonora.
- Sonido de la alarma.