Clever Trend Oasis MT5
- Indicadores
-
Carlos Forero
 Soy un desarrollador y trader profesional con más de una década de experiencia en los mercados de capitales y la creación de portafolios algorítmicos. Me especializo en sistemas automatizados y herramientas de análisis técnico avanzado para MetaTrader.
⚙️ Filosofía de Desarrollo - Versión: 1.286
- Actualizado: 29 diciembre 2023
- Activaciones: 5
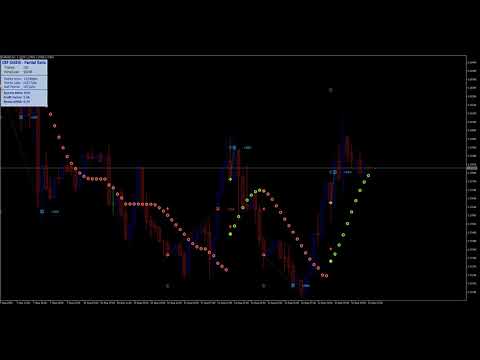
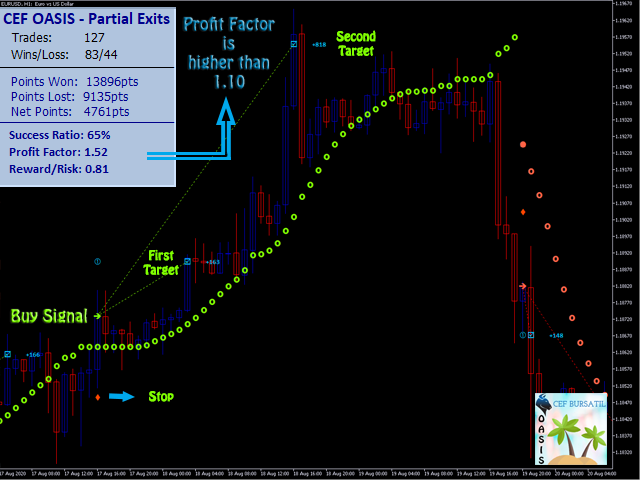
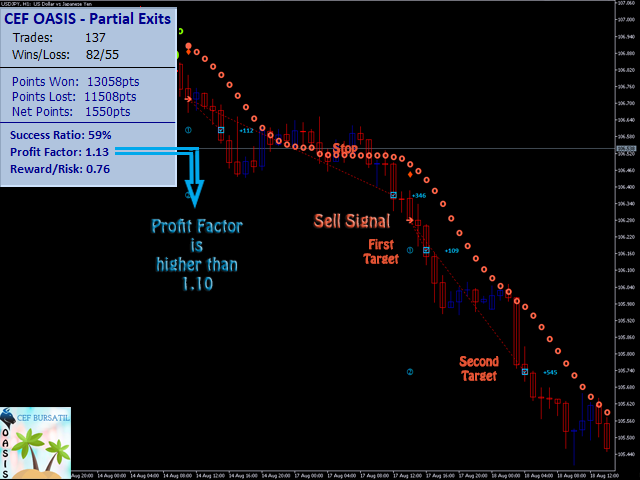
El indicador se basa en una estrategia de éxito probado. Muestra señales de compra y venta con un stop y un objetivo sugeridos. Del mismo modo, calcula las estadísticas esenciales de análisis de trading como el éxito y el ratio de beneficio.
ENLACES CLAVE: Manual del indicador - Cómo instalarlo - Preguntas frecuentes - Todos los productos
Características del indicador- Señales efectivas y comprensibles.
- Se puede utilizar como una estrategia de trading completa.
- Completas estadísticas de trading para evaluar el rendimiento del indicador.
- Muestra los puntos exactos de salida.
- Muestra la expectativa real de ganancia a través de sus indicadores de factor de ganancia, riesgo/recompensa y ratio de éxito.
- El indicador no se repinta.
- Funciona en todos los símbolos.
- Alertas integradas.
- Puede integrarse con cualquier robot o asesor experto.
Mostrar métricas
Todas las métricas siguientes se calculan en base a las estrategias de gestión monetaria seleccionadas y no tienen en cuenta las comisiones de la cuenta, spreads, swaps o cualquier otro coste transaccional:
- Número de Operaciones.
- Ganancias/Pérdidas.
- Puntos ganados en operaciones ganadoras cerradas.
- Puntos perdidos en operaciones perdedoras cerradas
- Puntos netos: Puntos ganados menos puntos perdidos
- Ratio de éxito: Porcentaje de operaciones ganadoras
- Ratio de beneficio: Puntos ganados / Puntos perdidos
- Recompensa/riesgo: Media de puntos ganados / Media de puntos perdidos
Parámetros:
Parámetro indicador:
- Parámetro de la señal: Parámetro de sensibilidad del indicador
- Sensibilidad ATR: Parámetro de sensibilidad del ATR.
- Velas a calcular: Velas a calcular del indicador
- Mostrar Pantalla, Objetos e Indicador.
Parámetros de gestión monetaria:
- Estrategia de Gestión Monetaria: Defina el método utilizado para calcular los Indicadores (Exit on TP1, Cierre la operación cuando el precio alcance el objetivo 1; Exit on TP2, Cierre la operación cuando el precio alcance el objetivo 2 y establezca un stop de equilibrio en el precio abierto cuando el precio alcance el objetivo 1; Exits parciales, Cierre la mitad de la operación en el objetivo 1, la otra mitad en el objetivo 2. y establezca un stop de equilibrio en el precio abierto cuando el precio alcance el objetivo 1).
- Método de negociación: Seleccione si puede operar en la misma dirección repetidamente.
- Tipo de Stop: Selección entre tipo de stop
- Multiplicador Stop de Rango: Multiplicador Si se selecciona el método de stop de rango
- Multiplicador del objetivo 1
- Multiplicador del Objetivo 2
- Limitación de TP2 basada en TP1
Otros Parámetros
- Parámetros de las alertas
- Parámetros de color, tamaño y estilo de los objetos
- Parámetros de visualización.
Recomendamos operar en un activo que muestre un factor de beneficio de las últimas 1000 velas de al menos 1,1. Además, puede aplicar filtros de tendencia, fuerza de la divisa, entre otros, para adaptar las señales a su estrategia personal.
Sobre el Autor:
Carlos Forero, Miembro de Clever Trading Club, organización privada con el propósito de diseñar soluciones inteligentes para generar beneficios constantes con riesgo adaptado.
Having spent far too much money on indicators in the past, I can honestly say that this one delivers after a month of use. Rarely will an author combine an indicator's performance, not measured is TP hit percentages, etc., but in terms of profitability. This indicator really does set a new standard.