Candle Zones PRO
- Indicadores
-
Flavio Javier Jarabeck
 We are a closed brotherhood of traders whose ultimate goal is to profit through well-studied, structured, and automated trades. As a result, we publish dozens of MT5 indicators (FREE and paid) to the global MQL5 community. 80% of our published products are high-quality free indicators so beginner
 - Versión: 1.1
- Activaciones: 20
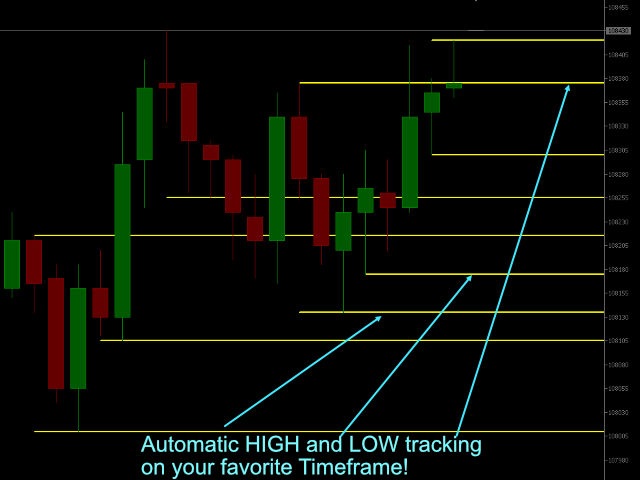
Probablemente haya oído hablar de los comportamientos de las Velas, que en la mayoría de las ocasiones pueden denotar y rastrear comportamientos de Volumen incluso si no está observando el Volumen en sí mismo... Bueno, este indicador hará esto. A los traders desnudos les encanta confiar únicamente en los patrones de las velas y con Candle Zones puedes atrapar patrones especiales y DIBUJARLOS en tu gráfico.
Tan simple como eso. Hay varios filtros que puede ajustar con el fin de lograr el análisis que desea. Pruébalo.
Después de varios meses de pruebas, pensamos que hemos creado un indicador muy fiable que puedes utilizar en tus sesiones de Day Trading, con la limitación del Timeframe M15, y sobre un número ilimitado de días pasados de análisis.
¿QUÉ OBTENDRÁ?
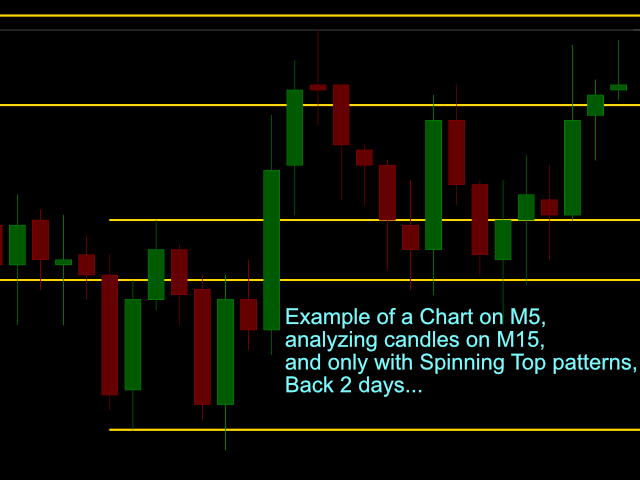
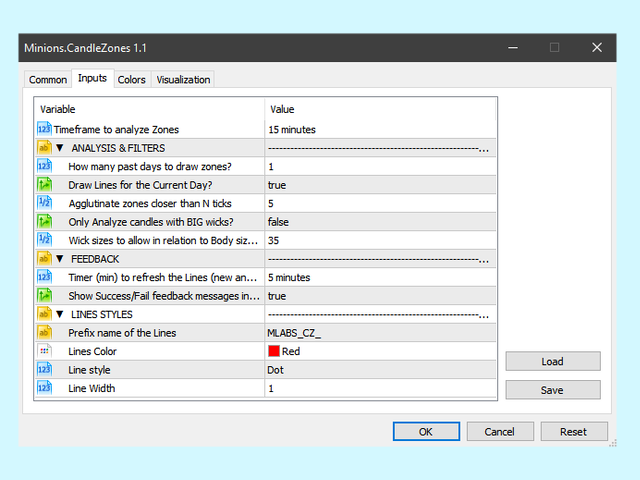
- Timeframe para Analizar Zonas - 5, 10, 15, 30 minutos, H1, H4, Diario, Semanal y Mensual. Es independiente del marco de tiempo del gráfico. Esa es la belleza de este indicador.
- ¿Cuántos días pasados utilizar en el análisis?
- ¿Dibuja líneas para el Día actual? (ON/OFF)
- Temporizador para actualizar las líneas.
- Posibilidad de nombrar las líneas dibujadas a tu gusto, de esta manera puedes leerlas desde tu EA.
- Para evitar demasiadas líneas y señales, aglutinamos las líneas que están dentro de un rango.
- ¿Quieres analizar todas las velas del timeframe o sólo aquellas con GRANDES MECHAS (como Spinning Tops y/o Dojis)?
- ¿Cuál sería el tamaño de la mecha en relación al cuerpo de la vela para considerar una vela Spinning Top/Doji?
AJUSTES ADICIONALES
- Mostrar todos los mensajes de retroalimentación del indicador para que funcione sin problemas.
- Color de Línea
- Estilo de Línea
- Ancho de Línea
Si desea probar una versión más ligera y completamente funcional de este indicador (sólo limitada por los Timeframes ofrecidos), por favor visite este enlace:
¿No ha encontrado la función que necesita?
Ningún producto es perfecto para todo el mundo. Si crees que necesitas una función que falta en nuestro producto, envíanos un mensaje. Nos encantan los comentarios.
¡Larga vida y prosperidad!
;)