CT Candle Breaking
- Indicadores
- Versión: 1.0
- Activaciones: 5

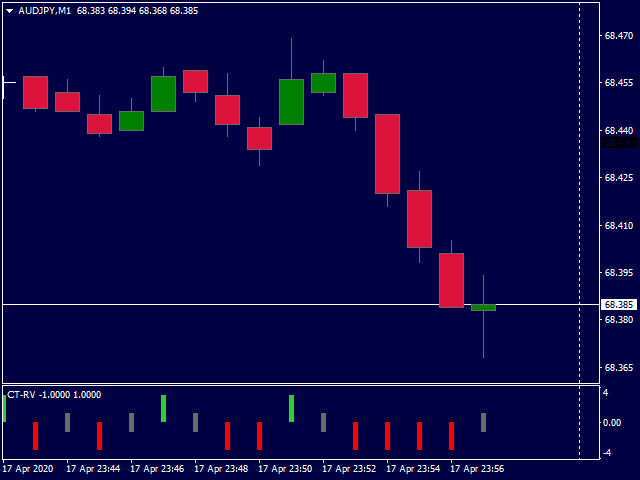
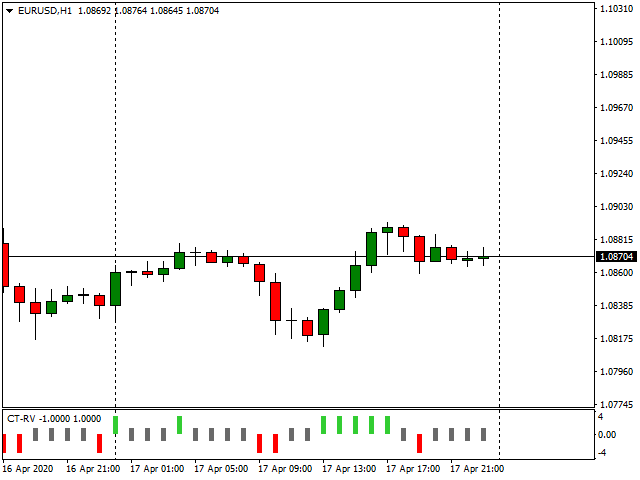
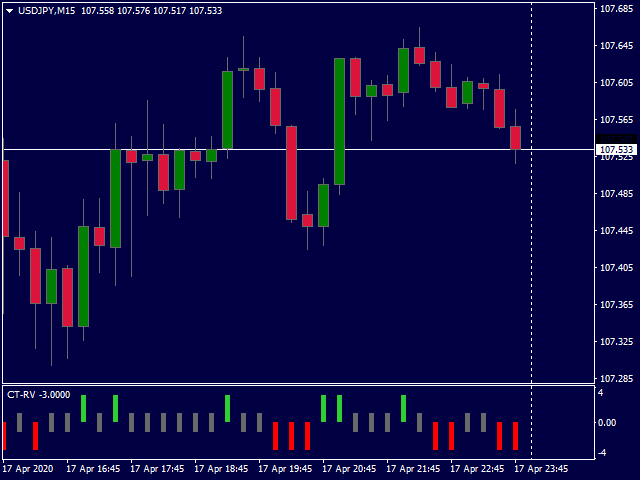
El indicador CT Candle Breaking se desarrolló para facilitar la identificación de rupturas de velas y filtrar los movimientos y la fuerza de las tendencias. Observando el comportamiento del indicador, podemos ver con mayor claridad los retrocesos, las continuaciones y los cambios de tendencia, y puede utilizarse en cualquier marco temporal.
El color verde representa una ruptura del máximo de la vela anterior.
El color rojo representa una ruptura del mínimo de la vela anterior.
El color gris representa una vela que cierra por debajo del máximo anterior y por encima del mínimo anterior.