Sinal RSI
- Indicadores
- Versión: 1.0
- Activaciones: 5

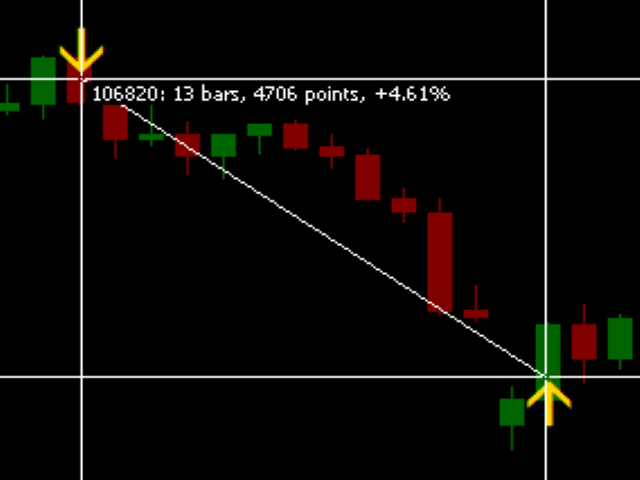
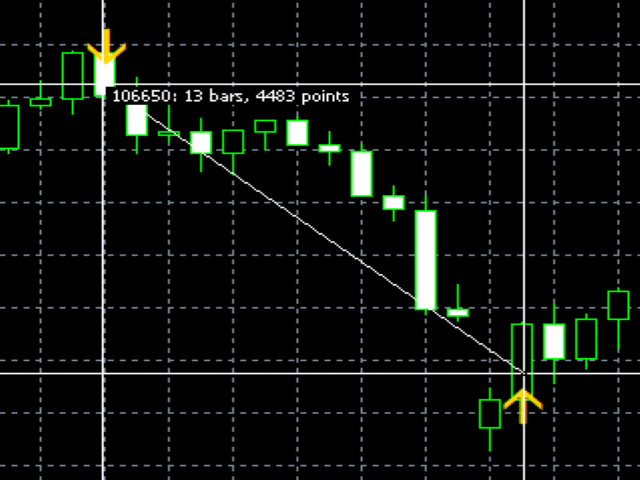
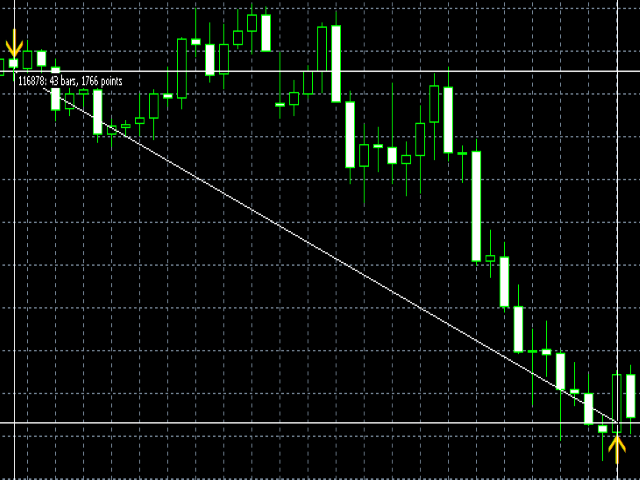
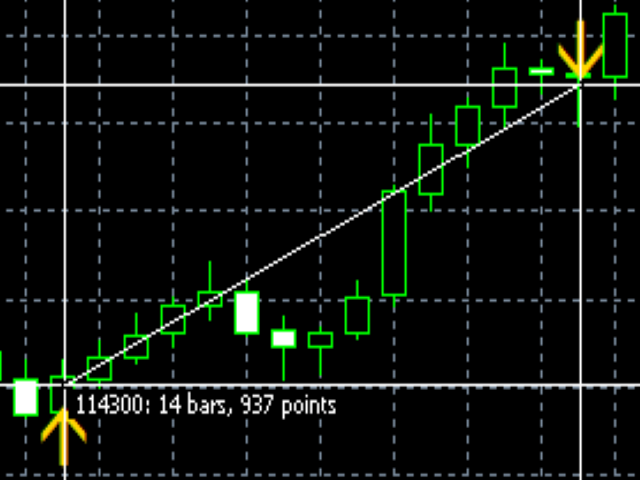
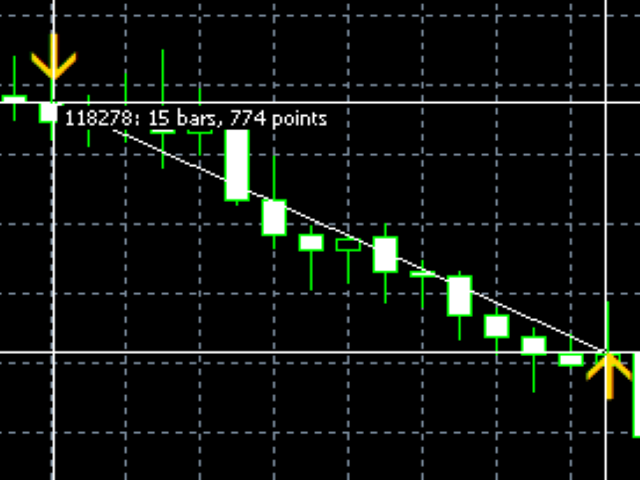
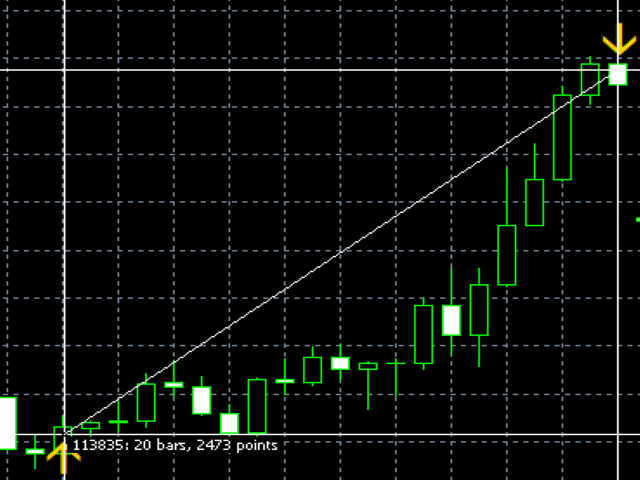
Signal RSI imprime los mejores tiempos de entrada según el indicador RSI en el gráfico.
Aparecerá una flecha en el gráfico indicando el momento y la dirección para entrar en la operación.
La operación se cierra cuando se alcanza el beneficio esperado o el stop.
Si tiene una operación abierta y aparece otra flecha en la dirección opuesta, ¡invierta la mano y aprovéchela!
Probado ampliamente en gráficos de mini índices y mini dólares, así como en acciones y FIIs.
Gráficos recomendados: 5, 10, 15 min.