Percent Levels
- Indicadores
- Versión: 2.0
- Actualizado: 25 agosto 2023
- Activaciones: 5

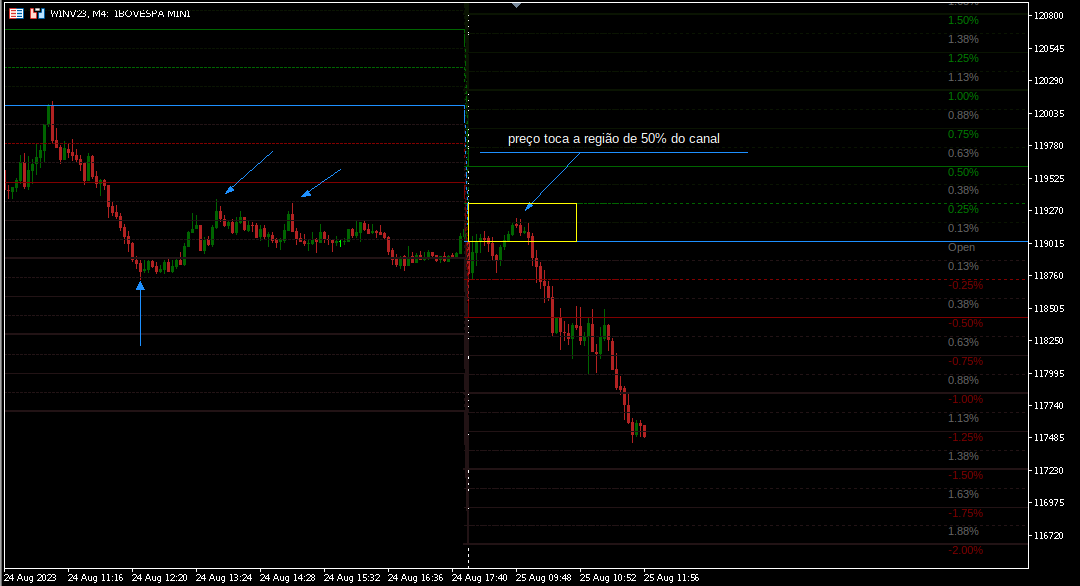
El indicador de frecuencia 2mv muestra los niveles porcentuales del mercado financiero que suelen ser zonas realmente importantes para los operadores. Observa que el precio sigue un flujo y una frecuencia que encajan en canales porcentuales de movimiento, tradicionalmente trazados por niveles de Fibonacci.
El indicador LevelsPercent traza líneas en puntos porcentuales concretos configurados por el usuario y "pueden" preceder a posibles niveles de SOPORTE y RESISTENCIA.
La lectura del mercado y la identificación de un patrón de amplitud y frecuencia de movimiento del precio pueden hacer de este sencillo indicador un gran aliado en diferentes estrategias de trading.
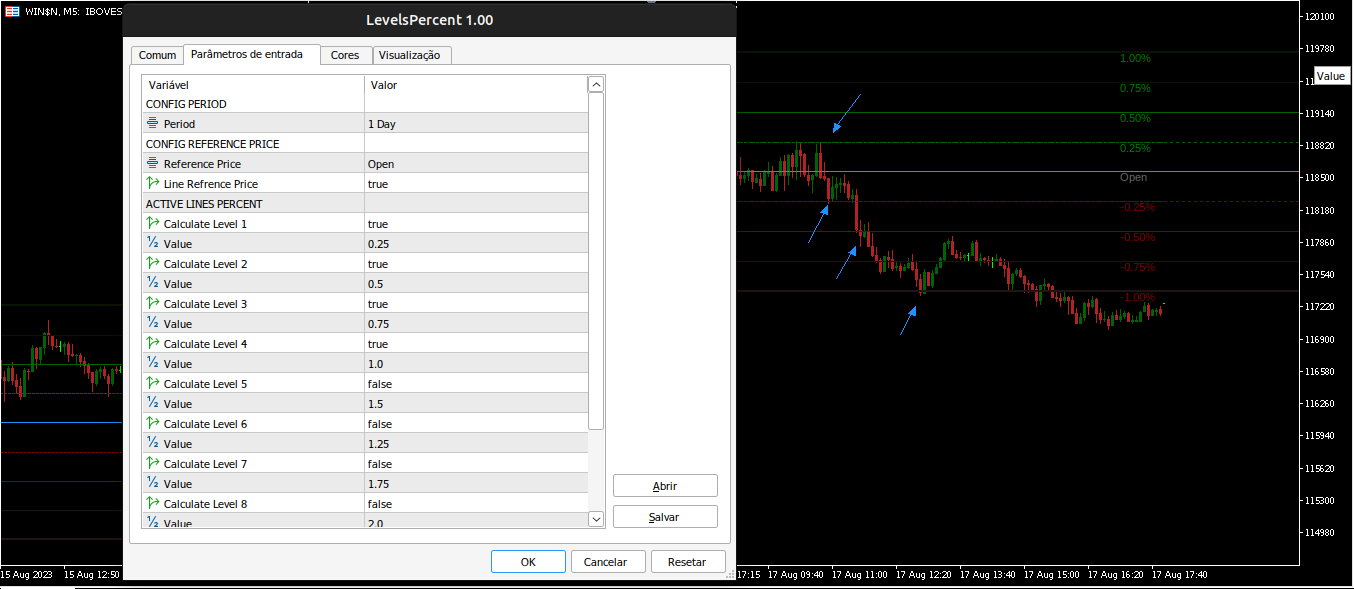
La configuración es sencilla:
Periodo:
Período de cálculo de los porcentajes;
DÍA = Período diario;
SEMANA = Período semanal;
Precio de referencia
Precio de referencia para el cálculo;
OPEN = Precio de apertura actual del periodo seleccionado (DÍA o SEMANA);
CLOSE_PREVIOUS = Precio de cierre anterior del período seleccionado (DÍA o SEMANA);
NIVELES ACTIVOS PORCENTUALES
Puede generar hasta 8 niveles porcentuales, los valores se reflejan hacia abajo, por ejemplo si introduce 0,25,
se dibujará una línea de Resistencia en el nivel 0,25% y otra línea en -0,25%, partiendo del precio de referencia seleccionado.
Calcular Nivel = Si es "true" habilita la línea, si es "false" no se calcula el nivel.
Valor = valor porcentual.
Mostrar Etiquetas = ¿Mostrar leyenda?
Tamaño de Fuente Etiquetas = Tamaño de fuente de la leyenda;
Posición Etiquetas = Posición de la leyenda.