TBL for mt5
- Indicadores
- Versión: 1.0

El indicador Trade by levels for mt5 está diseñado para determinar automáticamente la formación de un modelo para entrar en el mercado en el gráfico del instrumento seleccionado.
Definiciones:
⦁ BFl es la barra que formó el nivel.
⦁ BCL1 y BCL2 barras, que confirman el nivel.
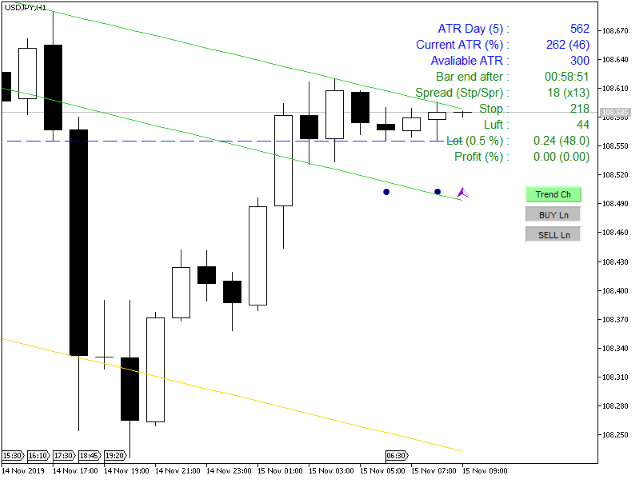
El modelo gráfico:
⦁ niveles high\low las barras BFL y BCL1 deben coincidir con la precisión al punto.
⦁ puede haber cualquier número de barras entre BFL y BCL1.
⦁ entre BCL1 y BCL2 no debe haber barras intermedias.
⦁ el valor de una barra hi / lo BCL2 puede ser diferente de los valores de nivel (BFL y BCL1) el tamaño de la holgura. Holgura no más de 2-3 puntos.
⦁ en General, el modelo está formado por 3 barras: 1 barra - forma un nivel. 2 bar-confirma el nivel. 3 bar también necesita confirmar el nivel, 4 bar es la entrada.
Reglas de negociación modelo:
- Las operaciones se realizan según la tendencia de las órdenes limitadas. Sólo se negocia el rebote desde los niveles.
- Se puede operar en contra de la tendencia en los siguientes casos:
⦁ si el precio actual del instrumento está cerca del nivel.⦁ si el Emisor ha superado al menos el 75% de su ATR.
- 30 segundos antes del cierre de la orden límite BCL2 se establece con una sangría por encima / debajo del nivel del tamaño de retroceso (2-3 puntos).
- Stop se calcula como % del precio actual, se recomienda 0,2 - 0,5%.
- Si la orden no se abre, y el precio ha pasado 2 stops reales del precio de la orden pendiente - la orden se cancela.
- Herramienta: cualquiera.
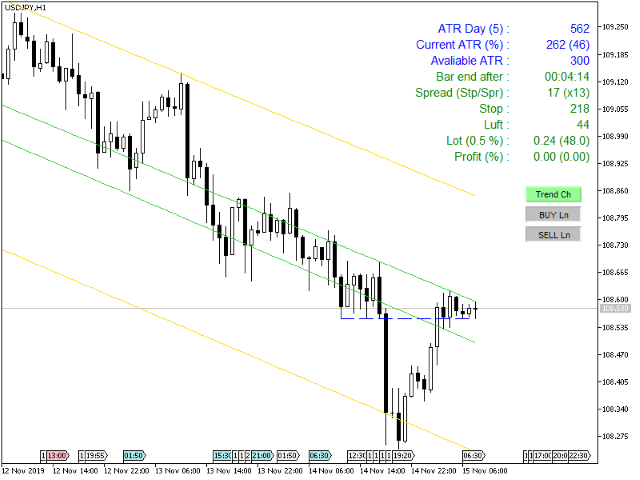
- Marcos temporales:
- D1-para determinar la tendencia, el valor ATR de los últimos 5 días.
- H1-para entrar en una operación en la señal del modelo.
Parámetros del indicador:
- Período ATR (día) - es el número de días para el cálculo del ATR.
- ATR en pips/punto - muestra el valor del ATR en pips.párrafos
- Ratio for TP/SL - relación entre take Profit y stop Loss
- Risk for calculate Lot, (% of Margin) - riesgo Porcentaje de margen libre para el cálculo del lote
- StopLoss en % de - tamaño del stop Loss en % del precio actual
- Disminuir SL 10 veces si TF 30 min -
- Si el periodo del gráfico es < 30 min, los valores de StopLoss y Luft se reducen 10 veces
- Gap for level on BCL2, (% of StopLoss) - la cantidad de "juego" para una barra BCL2, en % del stop loss
- Número de barras para calcular la tendencia - número de barras para calcular la tendencia
- Text color1 - color de los datos de la etiqueta
- Text color2 - color de los datos de la etiqueta
- Text color3 - color de los datos de la etiqueta
- Color de las líneas Stop&Take (órdenes de COMPRA) - color de las líneas Stop para las órdenes de compra
- Color de las líneas Stop&Take (órdenes de VENTA) - color de las líneas Stop para las órdenes de VENTA
- Stop&Take line style - tipo de líneas de órdenes Stop
- Dígitos en Profit% después de coma - número de dígitos después del punto decimal en el valor Profit
- Tamaño de fuente para el texto - tamaño de fuente para mostrar los datos
- Vertical shift for button - desplazamiento vertical de los botones
- Desplazamiento horizontal del botón - desplazamiento horizontal de los botones
- Desplazamiento horizontal para el texto "nombre" - desplazamiento horizontal de la columna de designación de datos
- Desplazamiento horizontal del texto "datos" - desplazamiento horizontal de la columna de datos
- Color del botón de estado "OFF" - color de los botones en estado "OFF
- Color del botón de estado "ON" - color de los botones en estado "ON
- Alerta emergente On/Off - activar/desactivar mensaje emergente
- Activar/desactivar la función Enviar notificación
- Activar/desactivar la función Enviar correo
Funciones:
- Salida del valor de ATR en pips\pips
- Controlar el valor actual de ATR si > 80% es rojo
- Controlar la relación Spread/Stop Loss si < 5 - rojo
- Después del tamaño del lote entre paréntesis el tamaño de la pérdida cuando se activa StopLoss
- La función de mostrar los niveles de órdenes Stop
- Botones Trend Ch, Buy, Sell - on\off muestra las líneas correspondientes en el gráfico

Me atrapalhei um pouco no início. Leva um bom tempo pra entender a dinâmica dos sinais, Ajuda a levar loss menores.