TBL for mt5
- Indikatoren
- Version: 1.0

Der Indikator Trade by levels for mt5 wurde entwickelt, um automatisch die Bildung eines Modells für den Einstieg in den Markt auf dem Chart des ausgewählten Instruments zu bestimmen.
Definitionen:
⦁ BFl ist der Balken, der das Level gebildet hat.
⦁ BCL1 und BCL2 Balken, die das Niveau bestätigen.
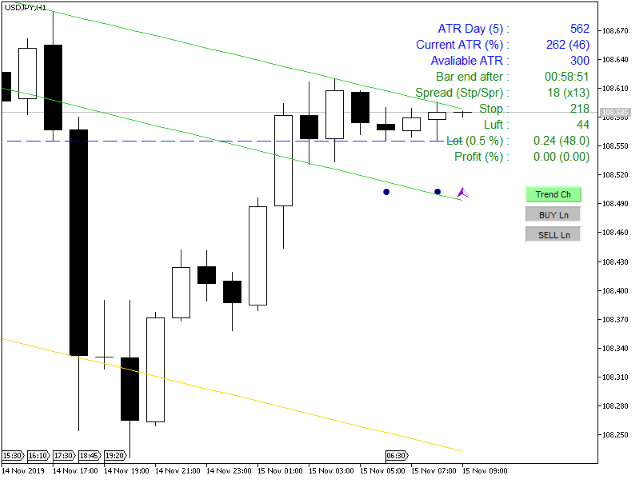
Das grafische Modell:
⦁ Niveaus hoch\low die Balken BFL und BCL1 müssen die Genauigkeit auf den Punkt bringen
⦁ es können beliebig viele Balken zwischen BFL und BCL1 liegen.
⦁ zwischen BCL1 und BCL2 sollten keine Zwischenbalken liegen.
⦁ der Wert eines Hi/Lo-Balkens BCL2 kann sich von den Pegelwerten (BFL und BCL1) unterscheiden, die Größe des Spiels. Spiel nicht mehr als 2-3 Punkte.
⦁ im Allgemeinen wird das Modell durch 3 Balken gebildet: 1 Balken - bildet eine Ebene. 2 Balken - bestätigt das Niveau. 3 bar muss auch die Ebene zu bestätigen, 4 bar ist der Eingang.
Modell Handelsregeln:
- Der Handel wird nach dem Trend der Limit-Orders durchgeführt. Gehandelt wird nur der Rebound von den Niveaus.
- Sie können gegen den Trend in den folgenden Fällen handeln:
⦁ wenn der aktuelle Preis des Instruments ist in der Nähe der Ebene.⦁ wenn der Emittent mindestens 75% seiner ATR überschritten hat.
- 30 Sekunden vor dem Schließen des BCL2 wird eine Limit-Order mit einem Einzug über/unter dem Niveau der Backlash-Größe (2-3 Punkte) gesetzt.
- Der Stop wird in % des aktuellen Kurses berechnet, empfohlen sind 0,2 - 0,5 %.
- Wenn die Order nicht eröffnet wird und der Preis 2 tatsächliche Stops vom Preis der schwebenden Order überschritten hat - wird die Order storniert.
- Werkzeug: beliebig.
- Zeitrahmen:
- D1, um den Trend zu bestimmen, den ATR-Wert der letzten 5 Tage.
- H1, um einen Handel auf der Grundlage des Modellsignals einzuleiten.
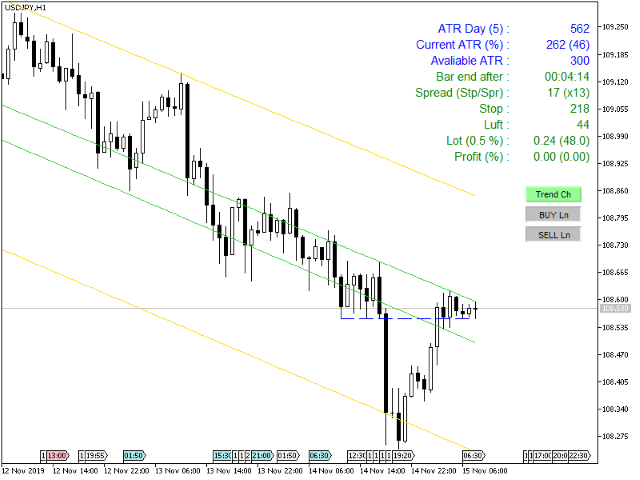
Parameter des Indikators:
- Periode ATR (Tag) - ist die Anzahl der Tage für die ATR-Berechnung
- ATR in Pips/Punkt - zeigt den Wert der ATR in Pips/Punkten an.
- Verhältnis für TP/SL - Verhältnis zwischen Take Profit und Stop Loss
- Risk for calculate Lot, (% of Margin) - Risikoprozentsatz der freien Margin für die Lotberechnung
- StopLoss in % von - Stop Loss Größe in % des aktuellen Kurses
- SL 10 mal verringern, wenn TF 30 min -
- Wenn die Chartperiode < 30 min ist, werden die Werte von StopLoss und Luft um das 10-fache reduziert
- Gap für Level auf BCL2, (% von StopLoss) - die Höhe des "Spiels" für einen Bar BCL2, in % des StopLoss
- Anzahl der Balken zur Trendberechnung - Anzahl der Balken zur Trendberechnung
- Textfarbe1 - Farbe der Beschriftungsdaten
- Textfarbe2 - Farbe der Etikettendaten
- Textfarbe3 - Farbe der Etikettendaten
- Farbe der Stop&Take-Linien (BUY-Aufträge) - Farbe der Stop-Order-Linien für Kaufaufträge
- Farbe der Stop&Take-Linien (SELL-Orders) - Farbe der Stop-Order-Linien für SELL-Orders
- Stop&Take-Linienart - Art der Stop-Order-Linien
- Ziffern in Profit% nach dem Komma - Anzahl der Ziffern nach dem Dezimalpunkt im Profit-Wert
- Schriftgröße für Text - Schriftgröße der Datenanzeige
- Vertikale Verschiebung für Schaltflächen - vertikale Verschiebung der Schaltflächen
- Horizontale Verschiebung für die Schaltfläche - horizontale Verschiebung der Schaltflächen
- Horizontale Verschiebung für den Text "Name" - horizontale Verschiebung der Datenbezeichnungsspalte
- Horizontale Verschiebung für "Daten"-Text - horizontale Verschiebung der Daten-Spalte
- Farbe für die Status-Schaltfläche "AUS" - Farbe der Schaltflächen im Zustand "AUS"
- Farbe für die Status-Schaltfläche "EIN" - Farbe der Schaltflächen im "EIN"-Zustand
- Ein/Aus-Popup-Warnung - Popup-Meldung aktivieren/deaktivieren
- Funktion "Benachrichtigung senden" ein/aus
- Funktion Mail senden ein/aus
Eigenschaften:
- Ausgabe des Wertes von ART in Pips\pips
- Überwachen Sie den aktuellen ATR-Wert, wenn > 80% rot ist
- Kontrolle des Spread/Stop Loss-Verhältnisses, wenn < 5 - rot
- Nach der Losgröße in Klammern die Höhe des Verlustes bei ausgelöstem StopLoss
- Die Funktion der Anzeige des Niveaus der Stop Orders
- Buttons Trend Ch, Buy, Sell - on\off zeigen die entsprechenden Linien auf dem Chart an

Me atrapalhei um pouco no início. Leva um bom tempo pra entender a dinâmica dos sinais, Ajuda a levar loss menores.