Einstein Pivot Point
- Indicadores
- Versión: 1.1
- Actualizado: 26 enero 2020
- Activaciones: 10
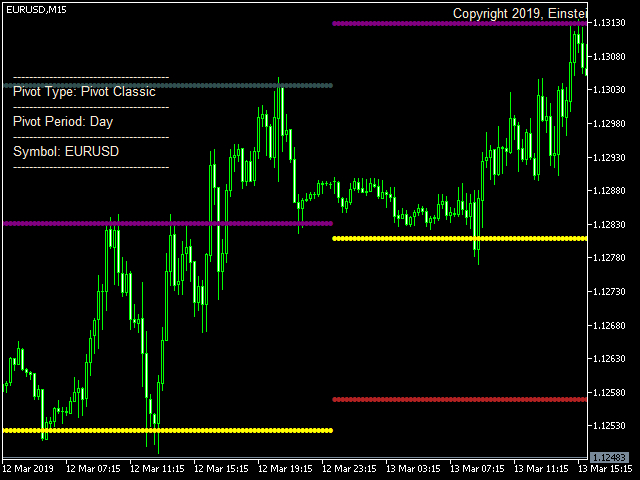
El indicadorEinstein Pivot Point le muestra los puntos de pivote y los niveles de soporte y resistencia por hora, semana o mes.
Puedes elegir 3 fórmulas diferentes para los niveles de soporte y resistencia (Fórmula Clásica, Puntos Pivote Woodie y Puntos Pivote Fibonacci).
Einstein Pivot Point calculará automáticamente elpunto pivote y los niveles de soporte y resistencia basándose en los datos del mercado.El trading requiere puntos de referencia (soporte y resistencia), que se utilizan para determinar cuándo entrar en el mercado, colocar stops y tomar beneficios. Soporte y
Las líneas de soporte y resistencia tienden a funcionar mejor en FX porque el gran tamaño del mercado protege contra la manipulación del mercado.
Los operadores profesionales de divisas utilizan los niveles de soporte y resistencia para identificar la dirección del movimiento de los precios.
Características:
-
Posibilidad de seleccionar cualquier tipo de pivote, por ejemplo, Clásico, Fibonacci y Woodies.
-
Posibilidad de seleccionar el periodo, por ejemplo, Pivote Diario, Pivote Semanal y Pivote Mensual.
-
Posibilidad de cambiar el color de todas las etiquetas.

El usuario no ha dejado ningún comentario para su valoración