Einstein Pivot Point
- Indikatoren
- Version: 1.1
- Aktualisiert: 26 Januar 2020
- Aktivierungen: 10
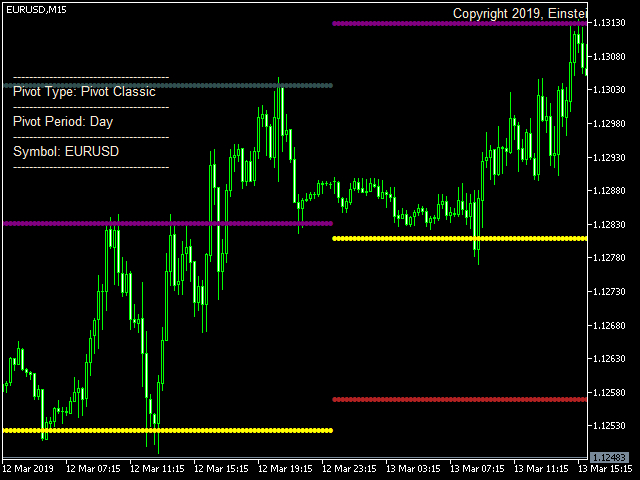
Der Einstein Pivot Point Indikator zeigt Ihnen stündliche, wöchentliche oder monatliche Pivot-Punkte sowie Unterstützungs- und Widerstandsniveaus an.
Sie können 3 verschiedene Formeln für die Unterstützungs- und Widerstandsniveaus wählen (Klassische Formel, Woodie Pivot Points und Fibonacci Pivot Points).
Einstein Pivot Point berechnet automatisch denPivot-Punkt und dieUnterstützungs- und Widerstandsniveaus auf der Grundlage der Marktdaten.Für den Handel werden Referenzpunkte (Unterstützung und Widerstand) benötigt, anhand derer der Zeitpunkt für den Einstieg in den Markt, die Platzierung von Stopps und die Gewinnmitnahme bestimmt wird. Unterstützung und
Widerstandslinien funktionieren in der Regel besser im Devisenhandel, da die Größe des Marktes vor Marktmanipulationen schützt.
Professionelle Devisenhändler nutzen Unterstützungs- und Widerstandsniveaus, um die Richtung der Kursbewegung zu bestimmen.
Merkmale:
-
Möglichkeit, einen beliebigen Pivot-Typ auszuwählen, z. B. Classic, Fibonacci und Woodies.
-
Möglichkeit, den Zeitraum auszuwählen, z.B. Daily Pivot, Weekly Pivot und Monthly Pivot.
-
Möglichkeit, die Farbe für alle Beschriftungen zu ändern.

Der Benutzer hat keinen Kommentar hinterlassen