Easy CCI Alerts
- Indicadores
- Versión: 1.2
- Activaciones: 20
El Commodity Channel Index (CCI) es un oscilador que se utiliza a menudo por los operadores de divisas para identificar las condiciones de sobreventa y sobrecompra de la misma manera que el RSI o Estocástico.
Cómo funciona
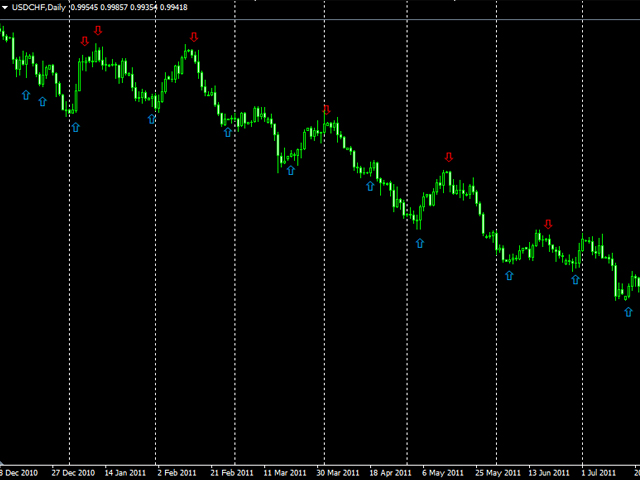
La idea detrás de este indicador es simple, esperamos a que el precio alcance un extremo (sobrecompra o sobreventa) y luego operamos cuando el precio parece cambiar de dirección con la esperanza de atrapar un movimiento fuera de la zona.
Señales de compra - El indicador espera a que el CCI se sobrevenda (un valor por debajo de -100). El indicador le notifica cuando el CCI se mueve de nuevo por encima de la línea -100.
Señales deventa - Las señales de venta se producen cuando el CCI se vuelve sobrecomprado (un valor por encima de +100) y le notifica cuando el valor vuelve a cruzar por debajo de +100.
Cuando se combina con el análisis de tendencias, esta estrategia ofrece algunos resultados prometedores, aunque es posible que observe periodos prolongados de caída. Para combatir esto, puede utilizar otros indicadores o la acción del precio para mejorar sus entradas.
Este indicador le ahorrará muchas horas en los mercados, dándole más tiempo para seleccionar las mejores entradas para operar. El indicador funciona en segundo plano y dibuja flechas en el gráfico cuando identifica una oportunidad de negociación.
Entradas
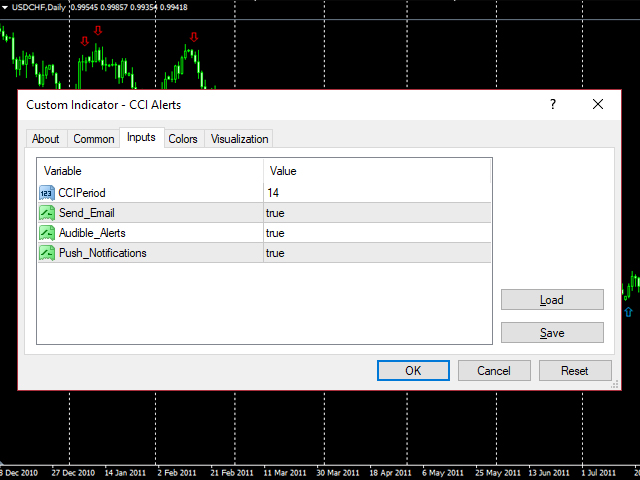
- CCIPeriod - El período del indicador CCI que se utiliza (por defecto es 14).
- Send_Email - El indicador enviará una notificación por correo electrónico.
- Audible_Alerts - Notificación estándar a través de la ventana 'Alerta' de MT4 incluyendo sonido.
- Push_Notifications - El indicador enviará una notificación push a su smartphone a través de la aplicación MetaTrader 4 iOS/Android.
Consejos
- La configuración para las notificaciones por correo electrónico y push se puede configurar yendo a'Herramientas' y luegoa 'Opciones'.
- Los resultados parecen mejorar cuando se opera en línea con la tendencia dominante.
- Para obtener mejores resultados, utilice siempre análisis adicionales para complementar cualquier indicador.
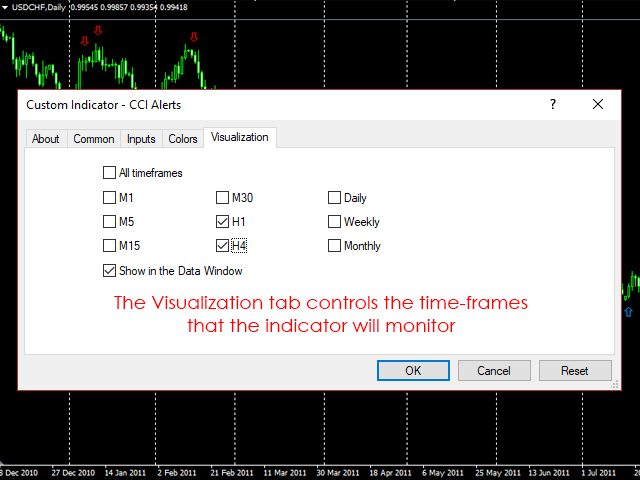
- Puede controlar los marcos temporales que están siendo monitorizados por el indicador utilizando la pestaña de visualización (sólo se monitorizarán los marcos temporales que estén seleccionados).

El usuario no ha dejado ningún comentario para su valoración