Advanced Price Movement Predictor Pro Edition MT5
- Indicadores
-
Boris Armenteros
 Take a look at our products here: https://www.mql5.com/en/users/barmenteros/seller
 - Versión: 3.3
- Actualizado: 5 abril 2019
- Activaciones: 20
Predice el movimiento de precios más probable a corto plazo basándose en cálculos matemáticos avanzados.
Características
- Estimación del movimiento inmediato de los precios;
- Cálculo de la tendencia real del mercado;
- Cálculo de los niveles de soporte y resistencia más importantes;
- Algoritmos optimizados para realizar cálculos matemáticos complejos con un consumo mínimo de recursos del sistema;
- Auto-ajuste para un mejor rendimiento, por lo que es capaz de funcionar correctamente en cualquier símbolo (no importa lo exótico que sea) y cualquier marco de tiempo;
- Compatible con cualquier plataforma MetaTrader, independientemente del número de dígitos u otros parámetros;
- Compatible con cualquier otra herramienta (indicador, EA o script) sin ralentizar el rendimiento del terminal y las operaciones de trading.
Introducción
La mayoría de los indicadores clásicos que conforman las estrategias de trading habituales se basan en matemáticas sencillas, no porque cuando se crearon estos indicadores no hubiera matemáticos sobresalientes (de hecho probablemente hubiera mejores matemáticos entonces que ahora), sino porque los ordenadores no existían o simplemente tenían una baja capacidad de procesamiento para realizar operaciones matemáticas complejas de forma consistente. Hoy en día, cualquier smartphone supera abrumadoramente al ordenador más potente de hace sólo unas décadas. Así que la capacidad de procesar enormes cantidades de información no es una limitación en estos tiempos, salvo para simulaciones de procesos extremadamente complejos.
El indicador Advanced Price Movement Predictor (APMP) aprovecha la capacidad de procesamiento actual para captar la esencia de las oscilaciones de los precios a través de algunos de los conceptos matemáticos, estadísticos y probabilísticos más avanzados.
APMP no proporciona una predicción en sí, ya que el movimiento del precio es un proceso estocástico no estacionario y, por lo tanto, no es predecible. Sin embargo, realiza una estimación dinámica y muy fiable del movimiento inmediato de los precios.
Basándose en el mismo análisis, APMP muestra la tendencia real actual del mercado. ¿Por qué tendencia real? ¿No es real la tendencia obtenida con otros indicadores? Hasta ahora la tendencia se obtiene casi siempre con indicadores clásicos como las Medias Móviles, las Bandas de Bollinger o el SAR Parabólico, o simplemente por el método tradicional de trazar manualmente una línea (o dos líneas paralelas) entre dos o más puntos significativos.
Obviamente, esos indicadores y métodos siguen siendo válidos, sobre todo porque son utilizados por la mayoría de los operadores, pero ¿obtienen la mayoría de ellos beneficios sostenidos? Intuimos que no. Con este indicador puedes reforzar o mejorar tu actual método de trading, o simplemente puedes descartarlo porque verás que hasta el comportamiento más caótico, como es el precio del mercado, respeta los grandes números y se limita al rigor de las todopoderosas leyes matemáticas.
Cómo utilizarlo
Básicamente, el uso de APMP no es diferente de cómo usted utiliza regularmente las tendencias, y los niveles de soporte y resistencia. La diferencia fundamental está en la fiabilidad y robustez de los valores calculados por este indicador.
El uso regular del APMP es el siguiente:
Para estrategias de trading basadas en la tendencia, los operadores deben comprar en zonas cercanas a los niveles de soporte mientras la tendencia es alcista, y vender en zonas cercanas a los niveles de resistencia mientras la tendencia es bajista.
Para las estrategias de negociación basadas en correcciones de tendencia (contratendencia), los operadores deben comprar en zonas cercanas a los niveles de soporte mientras la tendencia es bajista, y vender en zonas cercanas a los niveles de resistencia mientras la tendencia es alcista.
Observe que los niveles significativos pueden actuar como soportes o como resistencias, por lo que es importante tenerlo en cuenta a la hora de diseñar nuestra estrategia de trading y prestar especial atención al comportamiento del precio siempre que se encuentre cerca de dichos niveles.
El Stop Loss podría situarse a una distancia del precio de apertura igual a la separación entre los niveles de soporte y resistencia, y la distancia del Take Profit podría ser el doble de la separación anterior. Además, sería una buena idea utilizar un Trailing Stop para mover el Stop Loss cuando los niveles de soporte y resistencia se muevan a favor de la posición.
La estrategia descrita anteriormente es sólo una sugerencia básica, pero APMP proporciona suficiente información para crear una variedad de estrategias de negociación y mejorar las ya existentes.
Será interesante conocer diferentes estrategias derivadas de este indicador.
Cómo funciona
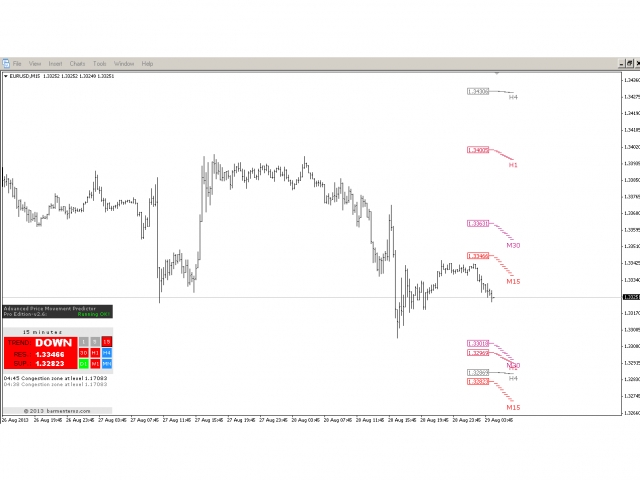
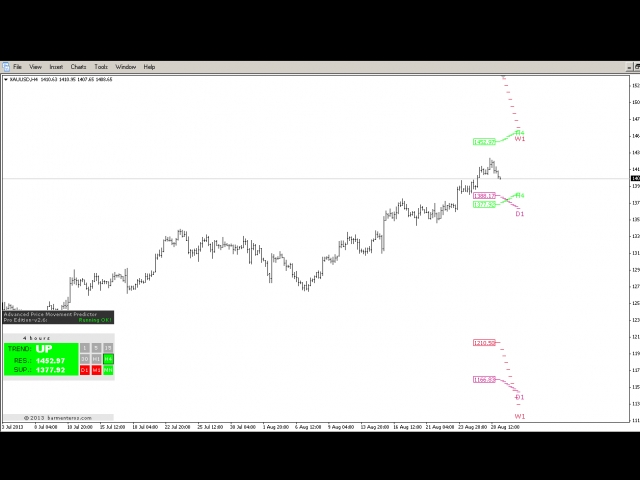
APMP muestra la siguiente información
- Los niveles de soporte y resistencia más cercanos al precio de mercado en el marco temporal actual y para el resto de periodos superiores.
- La tendencia real y el movimiento más probable del precio a corto plazo en el marco temporal actual y para el resto de periodos superiores.
- Alertas cuando aparecen zonas de congestión y cuando el precio cruza alguno de los niveles importantes. Las zonas de congestión son aquellas en las que coinciden 2 o más niveles.
Los usuarios también pueden activar las alertas por cuadro de diálogo y por correo electrónico. Tanto las alertas de APMP como las de MetaTrader van acompañadas de pitidos (alerta sonora). Además, todas las alertas se imprimen en la pestaña "Expertos" para poder consultarlas y analizarlas en el futuro.
Sobre APMP
Somos un pequeño equipo de programadores/traders que ofrecemos servicios profesionales de programación para el mundo del trading, principalmente para la plataforma MetaTrader. Nuestro equipo tiene alrededor de 7 años (como promedio) de experiencia en trading y alrededor de 6 años (como promedio) dedicados a la programación en MetaTrader. Hemos desarrollado Scripts, Indicadores y Asesores Expertos para muchos clientes de todo el mundo y para nuestro propio uso, como es el caso del indicador Advanced Price Movement Predictor (APMP).


Thanks
accurate!
(Edit: after a week of use, it seems the indicator will cause a lag in MT5 price updates when it is under heavy calculations workload--i7-9750H, which is a shame as the indicator is very useful, accurate, and a great addition to an active trader’s tool chest. Hopefully the dev is working on a solution).