Smooth oscillator for divergence
- Indicadores
-
Chinedu Onuoha
 Homme artificiel (Artificial Man): 100% automated EA
https://www.mql5.com/en/market/product/77937 - Versión: 1.0
- Activaciones: 5
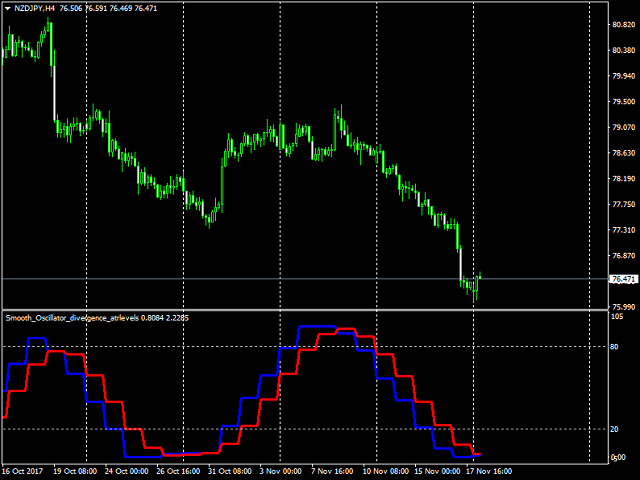
Este oscilador es suave como su nombre indica. También muestra flechas de divergencia ocultas. El indicador también tiene características multi timeframe para que sea muy flexible de usar. Las características multi marco de tiempo se puede ajustar de la siguiente manera: 1 o M1, 5 o M5, 15 o M15, 30 o M30, 60 o H1, 240 o H4, 1440 o D1, 10080 o W1.
Parámetros del indicador
- Timeframe - Si se establece en 0, funciona en el timeframe actual.
- Dibujar flechas de divergencia - Si está en True, permite dibujar líneas de divergencia.
- Mostrar alerta - Si se establece en Verdadero, permite que se muestren alertas cuando aparece una flecha de divergencia oculta.
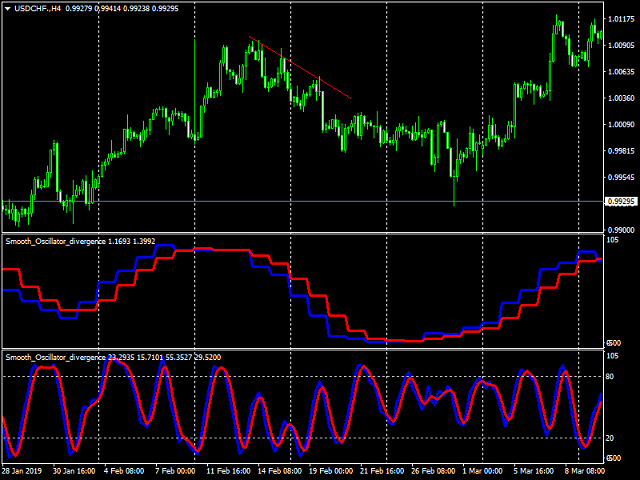

This is a smoother stochastic. Takes a lot of the confusion and noise out. Multi time frame. If you are familiar with George Lane he uses daily overbought/oversold signal off weekly stochastic readings. This works particularly well with support/resistance and hidden divergence. Very profitable.