Smooth oscillator for divergence
- インディケータ
-
Chinedu Onuoha
 Homme artificiel (Artificial Man): 100% automated EA
https://www.mql5.com/en/market/product/77937 - バージョン: 1.0
- アクティベーション: 5
This oscillator is smooth as the name implies. It also shows hidden divergence arrows. The indicator also has multi timeframe features to make it very flexible to use. The multi time frame features can be adjusted as follows: 1 or M1, 5 or M5, 15 or M15, 30 or M30, 60 or H1, 240 or H4, 1440 or D1, 10080 or W1.
Indicator parameters
- Timeframe - When set to 0, works on the current timeframe.
- Draw Divergence arrows - If set to True allows divergence lines to be drawn.
- Display Alert - If set to True, allows alerts to be displayed when hidden divergence arrow appears.
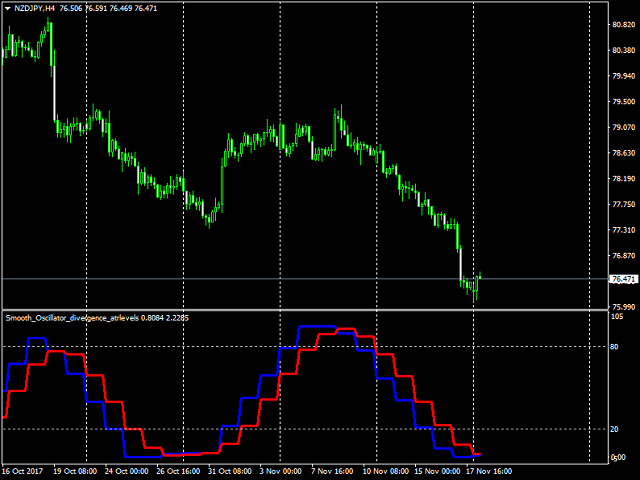
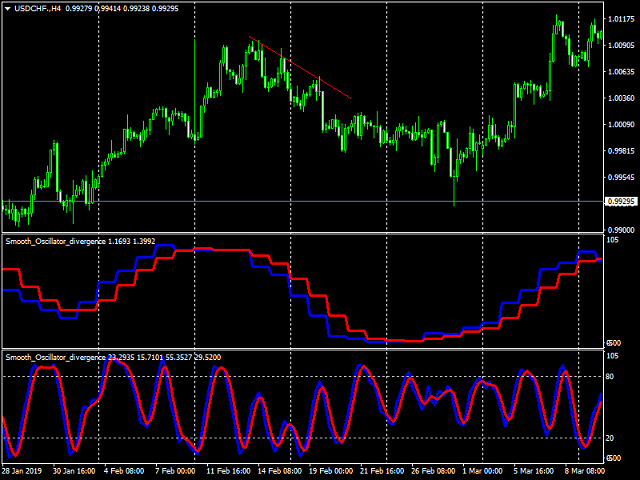

This is a smoother stochastic. Takes a lot of the confusion and noise out. Multi time frame. If you are familiar with George Lane he uses daily overbought/oversold signal off weekly stochastic readings. This works particularly well with support/resistance and hidden divergence. Very profitable.