AMD Exclusive Two
- Indicadores
-
Szymon Palczynski
 The world of grids and martingale.
Innovative solutions for currency markets. - Versión: 3.60
- Actualizado: 4 diciembre 2019
- Activaciones: 5
Uno de los mayores problemas a los que se enfrentará como comerciante es encontrar el sistema adecuado para usted.
AMD Exclusive Two puede constituir un sistema completo para usted.
No siga las flechas, sin pensarlo dos veces. Trading utilizando un sistema completo.
¿Qué tenemos?
- Optimización automática
- Desequilibrio (manual, semiautomático y automático)
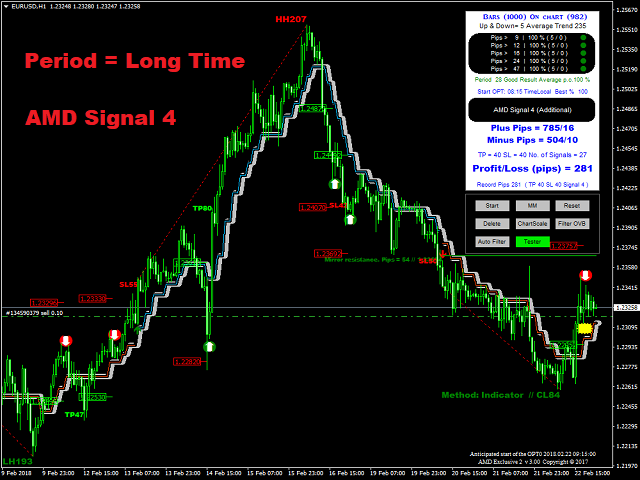
- Señales principales y adicionales
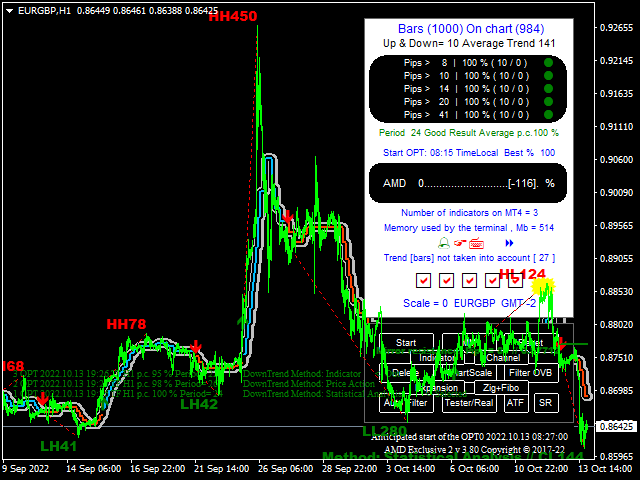
- Fibonacci
- Pivote
- Canal de regresión lineal
- Mini comprobador
- Sistema de alerta temprana (nube amarilla en el gráfico)
- Efecto 3D
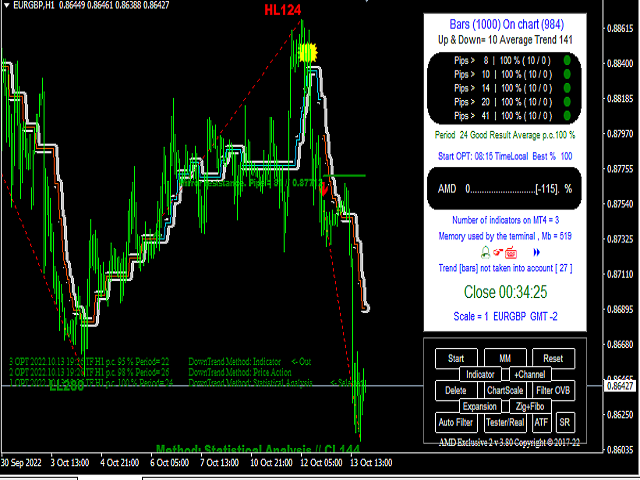
Botón en el gráfico
- Botón [Start] - Iniciar optimización
- Botón [MM] - Gestión del dinero
- Botón [Reiniciar] - Reiniciar
- Botón [Borrar] - Borrar indicador
- Botón [ChartScale] - Activar/desactivar el modo de escala fija
- Botón [Filter OVB] - Filtrado de tendencia basado en el sobrebalance (manual y semiautomático)
- Botón [Auto Filter] - Filtrado de la tendencia basado en el desequilibrio (automático)
- Botón [Tester/Real] - Back testing o señal actual
- Botón [Indicador] - indicador en el gráfico
- Botón [+Canal] - canal adicional en el gráfico
- Botón [Expansión] - Expansión de Fibonacci
- Botón [Zig+Fibo] - ZigZag y Fibonacci
- Botón [ATF] - marco temporal adicional
- Botón [SR] - soporte y resistencia
Parámetros de entrada
- ID - ID del gráfico.
- Método para determinar la tendencia - Análisis estadístico/Acción del precio/Auto/Indicador
- Profundidad del historial según:
- Barras - Número máximo de barras utilizadas
- Fecha - Número máximo de barras utilizadas por fecha (si Bars = 0)
- Periodo de Tendencia AMD - Optimización manual (3,4,5,..28)
- Optimización automática - verdadero/falso
- Alerta - Habilita las alertas sonoras
- Notificaciones Push - Habilita las alertas por smartphone
- Gestor de comandos - También puede realizar configuraciones utilizando archivos CSV para cambiar los valores de los parámetros. Ver el repositorio de comandos, que contiene todos los comandos disponibles en el sistema
- Correo electrónico - Activa las alertas por correo electrónico
- Captura de pantalla - Habilita la captura de pantalla para cada señal
- Informe - Este informe muestra los resultados de la optimización en el gráfico
- Shift - parámetro para un gráfico adicional
- Barras - parámetro para un gráfico adicional
- Color del cuerpo de una vela alcista - parámetro para un gráfico adicional
- Color del cuerpo de una vela bajista - parámetro para un gráfico adicional
- SR color of level lines (high) - color para soporte y resistencia
- SR color de las líneas de nivel (bajo) - color de soporte y resistencia
- Fibo color de las líneas de nivel - Fibonacci color de las líneas de nivel
- Rectángulo - visualización en primer plano (falso) o en segundo plano (verdadero)
- Profundidad para Zig Zag - 14 barras por defecto
- Valores de Fibo de las líneas - 13 niveles
- Take Profit - Toma de ganancias en el gráfico
- StopLoss - Stop loss en el gráfico
- Período - Tiempo corto/tiempo largo
- Señal - Elección de la señal
Optimización automática
- Iniciar optimización automática:
- Optimización automática si es verdadera
- Iniciar optimización
- Cambiar marco temporal
- Botón [Start] en el gráfico
- La optimización automática no funciona en el probador de estrategias
Gestor de comandos
Transferencia de archivos entre el smartphone y el indicador y viceversa. ¿Cómo funciona? Envíe un comando desde su smartphone y obtenga capturas de pantalla del gráfico. Aplicación necesaria que sincroniza y realiza copias de seguridad de archivos como fotos, documentos y correos electrónicos entre ordenadores de sobremesa, portátiles, servidores y unidades externas. ¿Más detalles? Escríbeme.
Repositorio de comandos:
- 1 = WindowScreenShot si se cierra la barra (evento único)
- 2 = WindowScreenShot si se cierra la barra (evento continuo)
- 3 = Iniciar optimización
- 4 = Señal
- 5 = WindowScreenShot (evento único)
- 6 = TimeFrame M15 (15)
- 7 = TimeFrame M30 (30)
- 8 = TimeFrame H1 (60)
- 9 = TimeFrame H4 (240)
- 10 = TimeFrame D1 (1440)
- 0 = Desactivar
El archivo se creará en la carpeta MQL4\Files.


HI,I've changed my review. Can you please send some further instructions. this product has potential