LRS Lineal Regresion Slope
- Indicadores
-
Jose Miguel Soriano
 Ingeniero Técnico en Informática de Gestión (Universidad de Almería)
 - Versión: 2.10
- Actualizado: 22 enero 2022
- Activaciones: 5
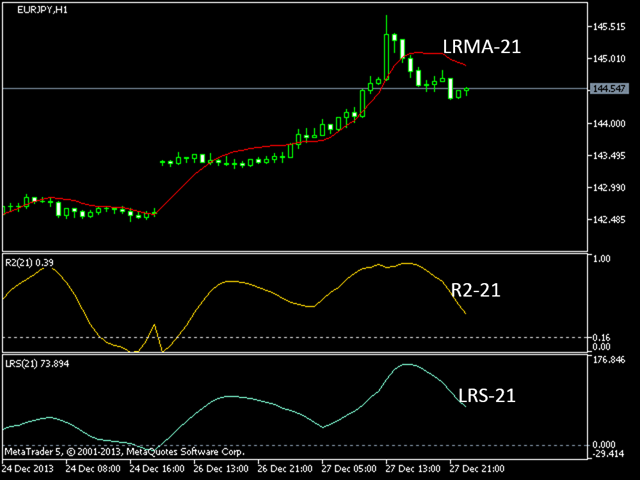
Si en lugar de dar el valor de regresión indicador del final de la recta de regresión (LRMA), damos el valor de su pendiente, obtenemos el LRS o Indicador de Pendiente de Regresión Lineal.
Dado que la pendiente es positiva cuando los precios suben, cero cuando están en rango y negativa cuando bajan, el LRS nos proporciona los datos sobre la tendencia de los precios.
Cálculo
                      sum(XY, n) - avg(Y, n)*sum(X, n)
  Y= a + mX;      m=  --------------------------------        a= avg(Y, n) - m*avg(X, n)
                      sum(X2, n) - avg(X, n)*sum(X, n)
Según las fórmulas anteriores, la media móvil de los valores "Y" construye el indicador LRMA; la media móvil de los valores "m" construye el indicador LRS .
La utilidad de este indicador aumenta cuando se utiliza con el indicador R-cuadrado que nos informa de la fuerza de la tendencia, mientras que LRS nos informa de la fuerza positiva o negativa.