TradeLeader OBV MA
- Indicadores
-
Cid Ougaske
 Dear customer, we are a company specialized in the indicators and EA development for Brazilian markets (B3 / Bovespa / BM & F) and Forex.
Please see some of our products: - Versión: 1.1
- Actualizado: 17 julio 2023
- Activaciones: 5
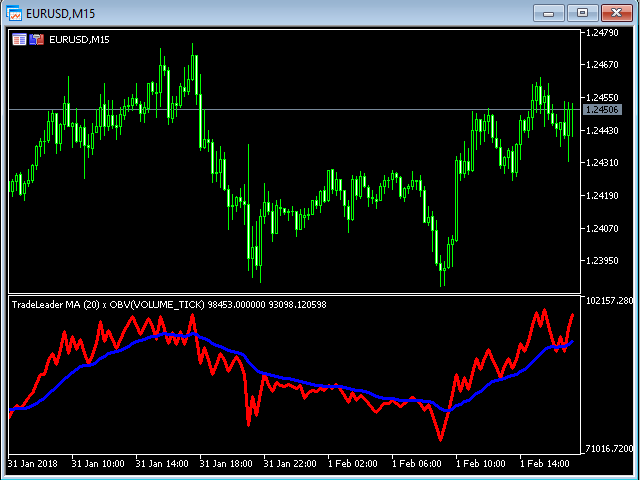
El indicador de volumen en balance (OBV) es un indicador de impulso y fue desarrollado en 1963 por Joseph E. Granville.
El OBV muestra la importancia de un volumen y su relación con el precio. Compara los flujos de volumen positivos y negativos con su precio a lo largo de un periodo de tiempo.
Para confirmar aún más que una tendencia puede estar debilitándose, Granville recomendó utilizar una media móvil de 20 periodos junto con el OBV.
De este modo, los usuarios del OBV podrían observar más fácilmente este tipo de acontecimientos observando cualquier cruce de la línea del OBV y su media móvil.
En Forex, no se dispone de la información del volumen real. Por lo tanto, OBV/MA funciona mejor en el mercado de valores.
Parámetros
- Tipo de Volumen: Tick o Real.
- Periodo de la media móvil: elija el periodo de la media móvil.
- Desplazamiento de la media móvil.
Puede incluir este indicador en su EA, script u otro indicador utilizando la función iCustom del lenguaje MQL5.

it can use,do not buy!