Breakeven Price MT5
- Indicadores
-
Vladimir Chiosa
 Reasons why you want to use my services:
1. I am a programmer with 20 years experience in forex, stocks, commodities and options markets and a trader with positive trading experience.
2. Technical analysis, risk management, optimization. - Versión: 1.6
- Actualizado: 26 noviembre 2021
- Activaciones: 5
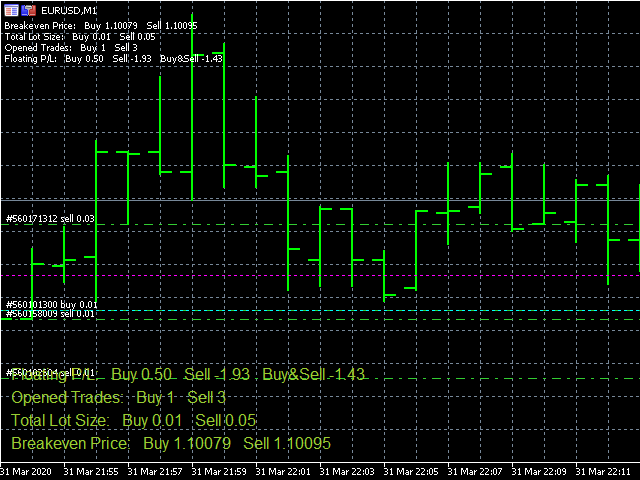
Hoy en día, muchos operadores necesitan abrir más posiciones para el mismo par, porque una posición no suele ser la mejor posible. Así se acumulan muchas operaciones, a veces con diferentes tamaños de lote, y no es fácil calcular el precio de equilibrio de todas las posiciones abiertas. Para resolver este problema se creó el indicador Breakeven Price.
Breakeven Price es un indicador MT5 que calcula en tiempo real el precio de equilibrio de todas las posiciones de compra y venta abiertas por el trader o EAs. Muestra en tiempo real en el gráfico las líneas, Buy breakeven line y Sell breakeven line, y proporciona también un comentario en el gráfico con el precio de equilibrio, el tamaño total del lote y la cantidad de operaciones abiertas para las órdenes de compra y venta. Fácil de usar y espero que sea útil para los comerciantes.
Parámetros del indicador
- BuyLine color - el color de la línea de equilibrio para las operaciones de compra.
- SellLine color - el color de la línea de equilibrio para las operaciones de venta.
- BuyLine style - el estilo de la línea de punto de equilibrio para las operaciones de compra.
- SellLine style - Estilo de la línea de punto de equilibrio para operaciones de venta.
- BuyLine width - Ancho de la línea de punto de equilibrio para operaciones de compra.
- SellLine width - Ancho de la línea de equilibrio para operaciones de venta.
- Backgroud BuyLine - muestra la línea de equilibrio de compra en el fondo.
- Backgroud SellLine - muestra la línea de punto de equilibrio de venta en segundo plano.
- Comentarioinformativo: activa/desactiva el comentario informativo.
- Panel de información: activar/desactivar el panel de información.
- Tamaño del texto del panel de información: ajuste el tamaño del texto del panel de información.
- Color del texto del panel de información: ajuste el color del texto del panel de información.
- Esquina del panel deinformación: seleccione la esquina del panel de información del gráfico.
- Incluir Swap - Activar/Desactivar la inclusión del Swap en el cálculo del precio de equilibrio.
- Incluyendo Comisión - Activar/Desactivar la inclusión de la Comisión en el cálculo del precio de equilibrio. (Esta función funcionará en caso de que la plataforma MT5 proporcione información de comisiones para las posiciones abiertas).
- Floating P/L - Activar/Desactivar la línea de información que proporciona Floating P/L.

HIGHLY RECOMMENDED!
MUST-HAVE FOR SERIOUS TRADERS WHO TAKE MULTIPLE POSITIONS ON 1 INSTRUMENT e.g. EUR/USD (and want to know what the overall breakeven price is).
I rented this indicator when it was Version 1.0. Vladimir has kindly made a number of improvements in response to my feedback. Version 1.5 is now fantastic!
Thank you, Vladimir, for developing and improving this Breakeven Price Indicator!!! Well done!!!