Breakeven Price MT5
- Indicatori
-
Vladimir Chiosa
 Reasons why you want to use my services:
1. I am a programmer with 23 years experience in forex, stocks, commodities and options markets and a trader with positive trading experience.
2. Technical analysis, risk management, optimization. - Versione: 1.6
- Aggiornato: 26 novembre 2021
- Attivazioni: 5
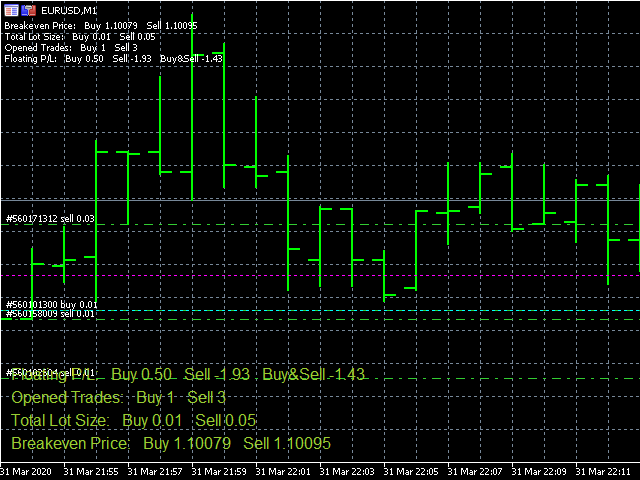
Nowadays a lot of traders need to open more positions for the same pair, because one position is not usually the best possible position. Thus a lot of trades are accumulated, sometimes with different lot sizes, and it is not easy to calculate the breakeven price of all opened positions. For solving this issue the Breakeven Price indicator was created.
Breakeven Price is an MT5 indicator which calculates real time the breakeven price of all Buy & Sell positions opened by trader or EAs. It shows real time on chart the lines, Buy breakeven line and Sell breakeven line, and it provides also a comment on chart with breakeven price, total lot size and amount of opened trades for Buy and Sell orders. Simple to use and I hope will be useful for traders.
Indicator parameters
- BuyLine color - the color of breakeven line for Buy trades.
- SellLine color - the color of breakeven line for Sell trades.
- BuyLine style - the style of breakeven line for Buy trades.
- SellLine style - the style of breakeven line for Sell trades.
- BuyLine width - the width of breakeven line for Buy trades.
- SellLine width - the width of breakeven line for Sell trades.
- Backgroud BuyLine - show the breakeven Buy line in background.
- Backgroud SellLine - show the breakeven Sell line in background.
- Info Comment - turn On/Off Info Comment.
- Info Panel - turn On/Off Info Panel.
- Info Panel text size - adjust Info Panel text size.
- Info Panel text color - adjust Info Panel text color.
- Info Panel corner - select Info Panel corner of chart.
- Including Swap - turn On/Off including Swap in calculation of breakeven price.
- Including Commission - turn On/Off including Commission in calculation of breakeven price. (This function will work in case MT5 platform provides commission info for opened positions.)
- Floating
P/L
- turn On/Off the info line which provides Floating P/L.

HIGHLY RECOMMENDED!
MUST-HAVE FOR SERIOUS TRADERS WHO TAKE MULTIPLE POSITIONS ON 1 INSTRUMENT e.g. EUR/USD (and want to know what the overall breakeven price is).
I rented this indicator when it was Version 1.0. Vladimir has kindly made a number of improvements in response to my feedback. Version 1.5 is now fantastic!
Thank you, Vladimir, for developing and improving this Breakeven Price Indicator!!! Well done!!!