Price Action Strength Indicator
- Indicadores
-
Robert Maidla
 A freelance developer of trading algorithms from Estonia since 2015. I have the Certificate in Advanced English level C1 (by Cambridge English Language Assessment) so I have no problem communicating in English. I am also an entrepreneur so I have great respect for deadlines which I consider
 - Versión: 3.2
- Actualizado: 10 octubre 2018
- Activaciones: 5
El indicador de fuerza de la acción del precio utiliza la forma más pura de datos disponibles en el mercado (acción del precio) para indicar la fuerza del movimiento del mercado. Leer la acción del precio y medir su fuerza es una cuestión subjetiva y es una técnica que lleva años dominar. El propósito del indicador es hacer que la lectura de la fuerza de la acción del precio sea lo más objetiva posible.
El indicador es mucho más avanzado que los osciladores predeterminados, porque además del movimiento del precio y su dirección, el indicador de la fuerza de la acción del precio examina las características del movimiento. Esto le permite ver el mercado a través de los ojos de un operador experimentado en la acción del precio.
La nueva versión utiliza los mismos valores de Price Action Strength que la versión 1.0, pero la versión 2.0 determina el sentimiento del mercado por usted. Hay 2 sentimientos posibles:
- Sentimiento de predicción/reversión, que se calcula utilizando los picos/bajos recientes del precio en comparación con el valor de la Fuerza de la Acción del Precio;
- Sentimiento de continuación/momento, que se calcula utilizando el impulso y el valor de la Fuerza de la Acción del Precio.
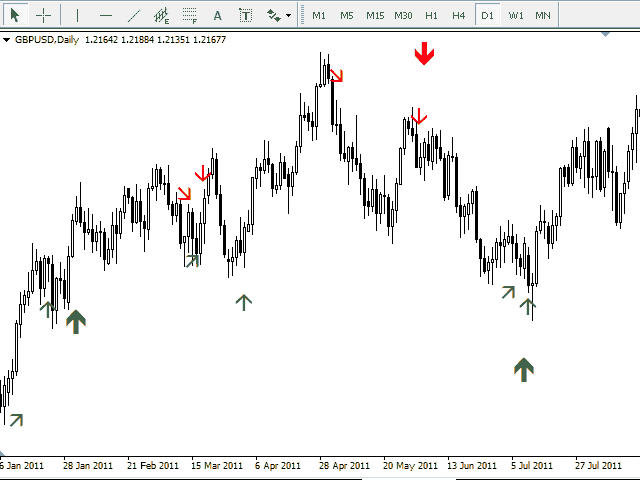
La nueva versión utiliza estas detecciones de sentimiento para producir flechas en el gráfico que muestran hacia dónde es probable que se mueva el mercado a continuación utilizando el análisis de la acción del precio puro.
Hay 3 tipos de flechas / buffers con la nueva versión (uno para cada dirección), además de los 2 buffers que se incluyeron en la versión 1.0:
- El búfer de fuerza calculará la fuerza relativa de la acción del precio comparada con la cantidad de velas pasadas del "Periodo" introducido. La información se visualiza mediante una línea en la ventana separada. Un movimiento ascendente de esta línea indica una fuerza alcista de la acción del precio, mientras que un movimiento descendente de esta línea indica una fuerza bajista de la acción del precio. Cuanto más alta es esta línea, más alcista es la fuerza de la acción del precio, cuanto más baja es la línea, más bajista es la fuerza de la acción del precio;
- El búfer de solapamiento calculará el solapamiento relativo de las barras actuales en comparación con la cantidad "Periodo" introducida de las velas pasadas. La información se visualiza mediante un histograma. Cuanto mayor sea el histograma, mayor será la fuerza de la acción del precio teniendo en cuenta la superposición de las barras. En otras palabras, cuanto más alto es el histograma, menos solapamiento existe entre las barras, lo que significa que el precio tiene una dirección concreta y no oscila, lo que indica un movimiento fuerte;
- El tope de reversión se indica con una flecha fina hacia arriba/hacia abajo. La flecha de reversión indica que la reversión del precio es probable. Las señales de reversión son las que producen más señales falsas, pero si son correctas, predicen los movimientos más grandes. Se recomienda utilizar un riesgo/recompensa de al menos 2 o mayor cuando se toman estas señales;
- El búfer decontinuación se indica con una flecha inclinada. La flecha de continuación indica que el mercado está ganando impulso en la dirección correspondiente. Estas señales aparecen a menudo durante una tendencia en curso y se entienden como una indicación de apoyo de que es más probable que el mercado continúe en el curso actual. Las señales de continuación proporcionan predicciones más precisas, pero los movimientos del mercado que las siguen no suelen ser enormes. Se recomienda utilizar estas señales para añadir a las operaciones de tendencia o scalps;
- El búfer de confirmación se indica con una flecha gruesa hacia arriba/hacia abajo. La flecha de confirmación aparece cuando tanto la señal de reversión como la de continuación aparecen durante la misma vela. Esto indica un movimiento altamente probable.
NOTA Todas las flechas aparecen al inicio de la vela en la que se encuentran y no se repintan.
Las flechas mostradas por el indicador pueden ser un sistema de comercio independiente, lo que significa que puede tomar las operaciones a medida que aparecen las flechas. También puede simplemente utilizar las flechas para determinar el sentimiento del mercado, ya que el análisis de la acción del precio da una predicción bastante precisa de hacia dónde se dirige el mercado.
Price Action Strength 2.0 funciona en todos los símbolos y marcos temporales, pero se recomienda utilizarlo en marcos temporales más grandes (H4 y superiores), ya que los principios del análisis de la acción del precio funcionan mejor cuanto mayor es el marco temporal.
Las entradas
- Periodo' - la cantidad de velas que el indicador utiliza para comparar los datos actuales.
- Umbral de la línea 0' - el umbral para el búfer de 'Fuerza' que se utiliza para determinar el sentimiento de confirmación/momento.
- Duración de las velas de sentimiento de impulso: duración de las velas para detectar el sentimiento de impulso/confirmación. Si durante estas velas el búfer de "Fuerza" ha hecho al menos un cierto % de cambios positivos/negativos, se considera que el mercado tiene un impulso en esa dirección.
- Momentum sentiment %' - el % de cambios positivos/negativos en el buffer 'Strength' durante el periodo de velas establecido con la entrada anterior requerida para confirmar un momentum en esa dirección.
- 'Tamaño fract al' - el tamaño fractal en una dirección. Se utiliza para determinar el sentimiento de predicción/reversión.
- 'Barras de confirmación ZigZag' - la cantidad de cierres requeridos para que el nivel ZigZag sea respetado para hacer frente al repintado. Los principios del indicador ZigZag se utilizan para determinar el sentimiento de predicción/reversión.
- 'Profundidad' - la profundidad para el indicador ZigZag.
- Desviación" - la desviación del indicador ZigZag.
- Paso atrás" - el paso atrás del indicador ZigZag.
- Mostrar una vez' - si es verdadero, las flechas deben alternarse. Por ejemplo, después de que aparezca una flecha de confirmación alcista, tiene que haber una flecha de confirmación bajista presente hasta que pueda aparecer una nueva flecha de confirmación alcista. Si es falso, el indicador muestra todas las señales de sentimiento que puede detectar.
- Mostrar predic ciónde cambio de sentimiento" - si es verdadero, las flechas de predicción de sentimiento aparecen en el gráfico.
- Mostrar cambio de sentimientode continuación" - si es verdadero, las flechas de sentimiento de continuación aparecen en el gráfico.
- Mostrar cambio de sentimiento de confirmación" - si es verdadero, las flechas de sentimiento de confirmación aparecen en el gráfico.
- Alertas": si es verdadero, el indicador envía una notificación de alerta al terminal MT4 cuando aparece cualquiera de las flechas junto con el nombre del símbolo en el que se ha producido el evento.
- Notificaciones push": si es verdadero, el indicador envía una notificación push cuando aparece cualquiera de las flechas junto con el nombre del símbolo en el que se ha producido el evento.
- Emails' - si es verdadero, el indicador envía un email cuando cualquiera de las flechas aparece junto con el nombre del símbolo en el que ocurrió el evento.


Your trading metrics are great!