SMArrows
- Indicadores
-
Maxim Kuznetsov
 My big personal project : http://nektomk.ru/en:atcl:start
Integration MT4 with world via Tcl :-) Excel, Mail, Networking, Rest-API, Websockets and many many others are accessable from MetaTrader. - Versión: 1.0
- Activaciones: 5
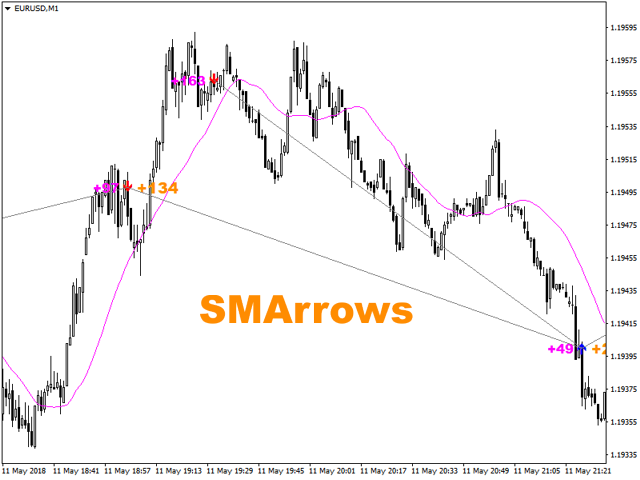
Señales de inversión SMA fiables. Sin repintado. Ajustes sencillos. Adecuado para opciones binarias. Hecho para la máxima comodidad de los traders.
El indicador realiza un análisis complejo de un movimiento de precios en relación con la SMA y muestra el conjunto que es más probable que sea seguido por un impulso de precios y la inversión de la SMA.
Mecanismos internos de clasificación clasifican las entradas definitivamente tardías, poco fiables o ineficaces.
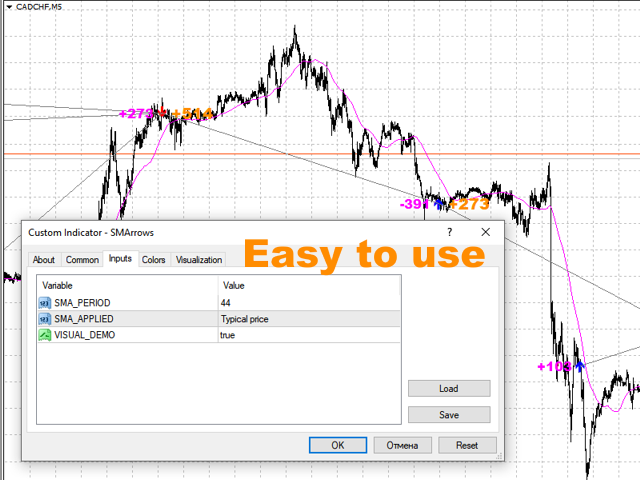
Opciones
- SMA_PERIOD - considerado periodo SMA no debe ser inferior a 24, el valor por defecto es 44
- SMA_APPLIED - precio de cálculo de la SMA, por defecto es Precio Medio
- VISUAL_DEMO - habilita la "emulación de trading" y muestra las distancias en puntos entre señales, deshabilitado por defecto
Visualización del indicador
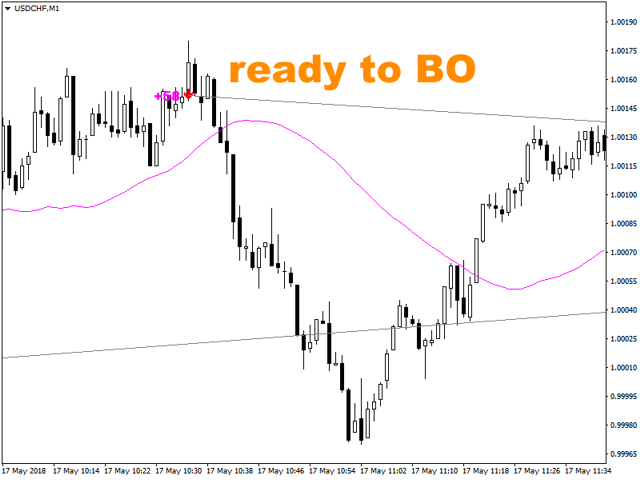
El indicador muestra SMA y flechas - recomendaciones de entrada detectadas. Las señales se activan en la apertura de una barra y nunca se redibujan.
El modo VISUAL_DEMO muestra las distancias en puntos entre señales acumuladas durante la emulación. Este modo le permite realizar ajustes rápidamente para un símbolo y un marco temporal seleccionados.
Aplicación
Se recomienda realizar las entradas en la dirección de una flecha. Establecer un stop loss algo más allá de un punto extremo en función de una volatilidad.
Al operar con opciones binarias, recomiendo establecer el período mínimo de 24.
Vale la pena comprobar más de cerca las señales opuestas a distancias múltiples del período SMA.
Dado que el análisis involucra osciladores y se considera una profundidad de historia limitada, puede haber una serie de señales unidireccionales en caso de un movimiento largo sin retrocesos.