Trend Trade mt5
- インディケータ
- バージョン: 21.111
- アップデート済み: 21 11月 2021
- アクティベーション: 20

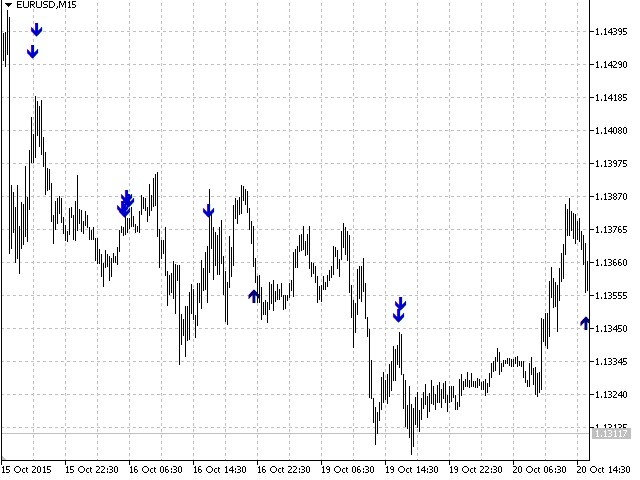
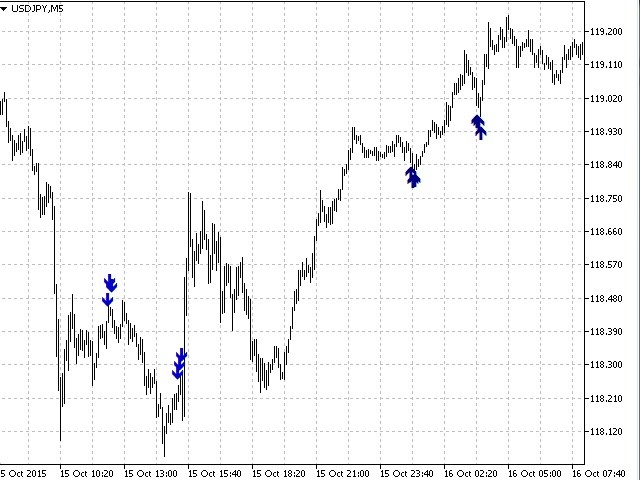
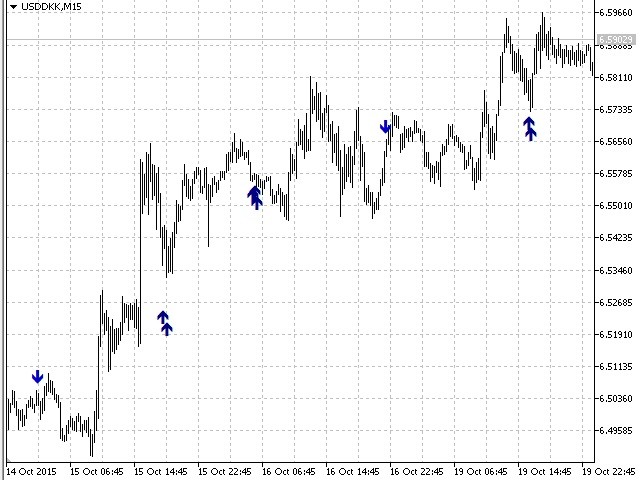
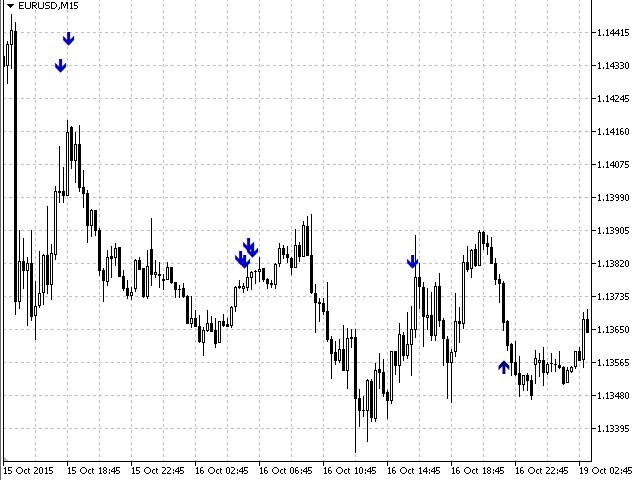
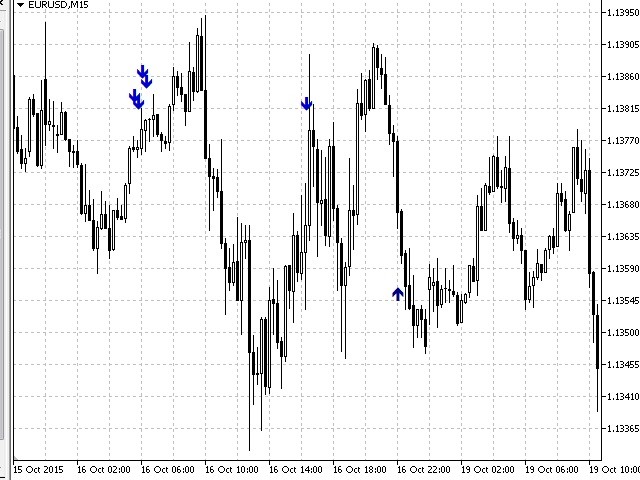
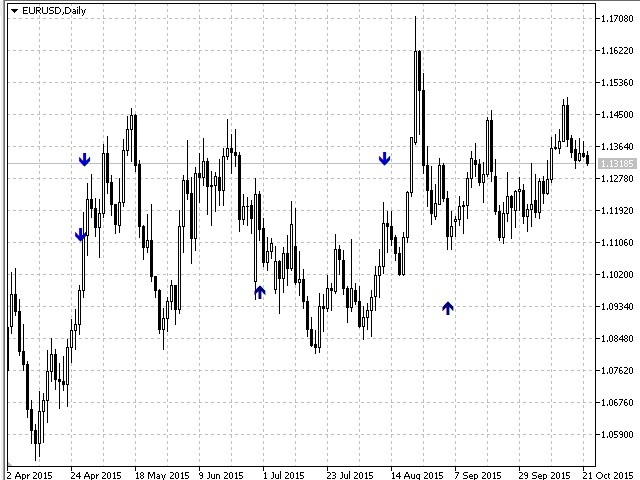
The Trend Trade indicator displays assumed turning points of the price on the chart in the direction of the trend after correction. It is based on the data of the Prise Reversal oscillator with the period 6 and indicators which characterize strength and availability of the trend. When the value of Prise Reversal is in overbought or oversold area (area size is set by a user), and the current trend is confirmed, the Trend Trade indicator draws an arrow pointed to the further assumed price movement.
Inputs
- PR – size of overbought/oversold areas of the Prise Reversal indicator. Default value is 25. If you decrease this value, the Trend Trade indicator will generate less signals but they will be more accurate. And vice versa for increasing.
- Trend – percentage of the price change on the last periods. Default value is 0.03. Value increase leads to decreasing the number of signals, but it also means that signals will be generated in points with exceptionally sharp movement.
- Alert – you can set an alert when a signal appears. True – display alert, False – no alert. Default value is False.
To get correct entry points, we recommend the following:
- Adjust parameters for each traded pair and timeframe;
- First, get a signal on a higher timeframe (for example, H1), then wait for a similar signal on a lower timeframe (for example, M15).