Elder Chandelier Short Entries
- Indicadores
-
Financial Trading Seminars Inc.
 Dr. Alexander Elder
Dr. Alexander Elder is a professional trader based in New York City. He is the author of 11 books, including Trading for a Living (1996) and - Versión: 2.0
- Actualizado: 17 noviembre 2021
- Activaciones: 5
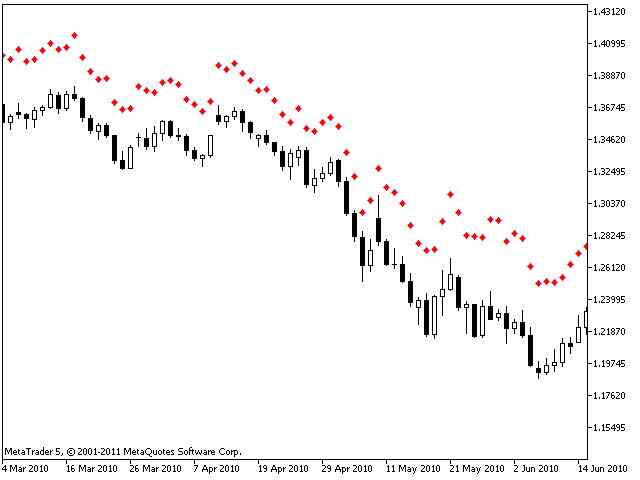
Una de las reglas clave en el trading es no mover nunca los stops de forma que aumente el riesgo. Nuestra secuencia de stops muestra el ajuste automático de los stops. Aparecen como una serie de puntos de riesgo decreciente hasta que la operación se detiene finalmente.
El problema es que si entra en una operación en un punto distinto del punto inicial de la secuencia, puede estar colocando el stop demasiado cerca. Los gráficos de stop de entrada le muestran el valor inicial del stop para cada barra. Puede utilizarlos cuando realice una operación y disminuir el valor cada día hasta que finalmente llegue a un stop.
Los indicadores de entrada tienen exactamente los mismos parámetros que las secuencias de stop (véase Elder Chandelier Short Exit).
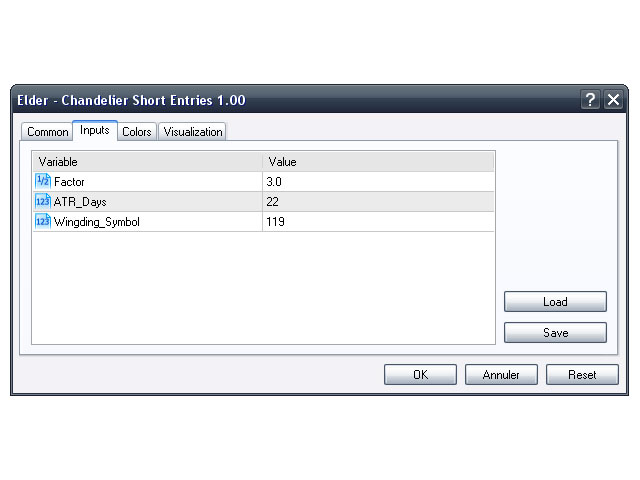
Parámetros:
- Factor (3) - Este es el factor para multiplicar el ATR cuando se calcula el Chandelier. Puede utilizar fracciones - no es necesario que sea un número entero.
- ATR_Days (22) - Número de días para calcular el ATR.
- Wingding_Symbol (159) - Símbolo a mostrar.