Practitioner
- Indicadores
- Versión: 1.0
- Activaciones: 5

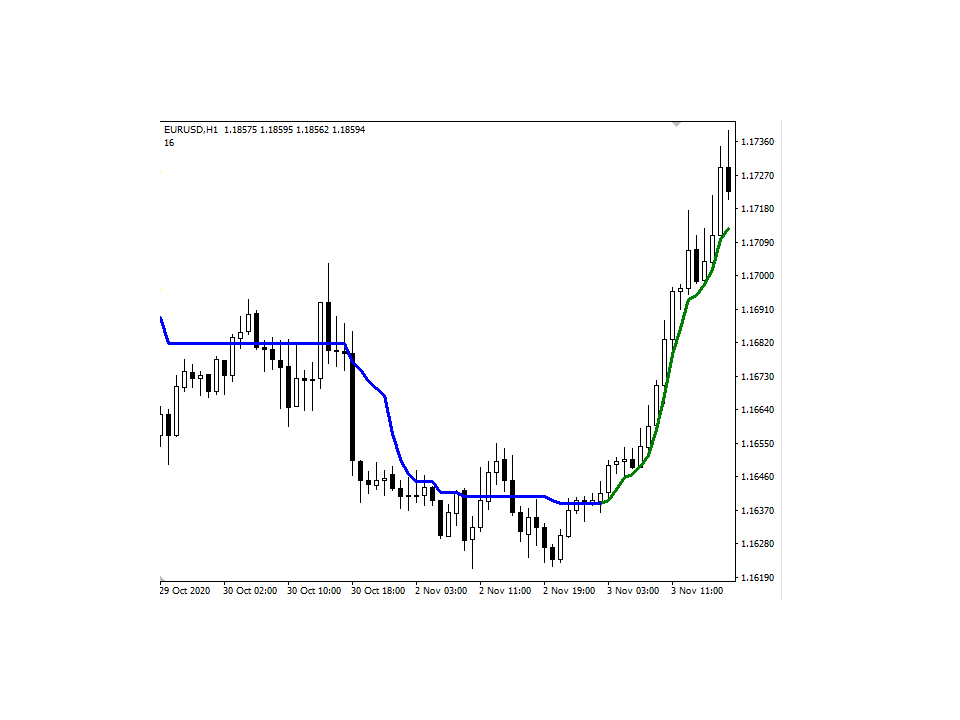
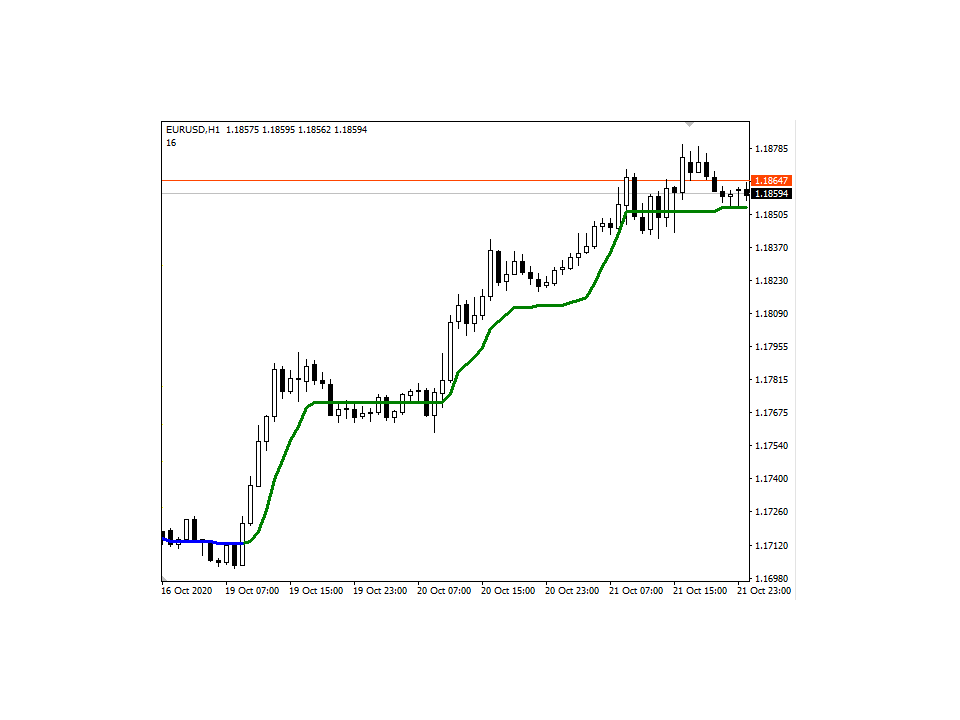
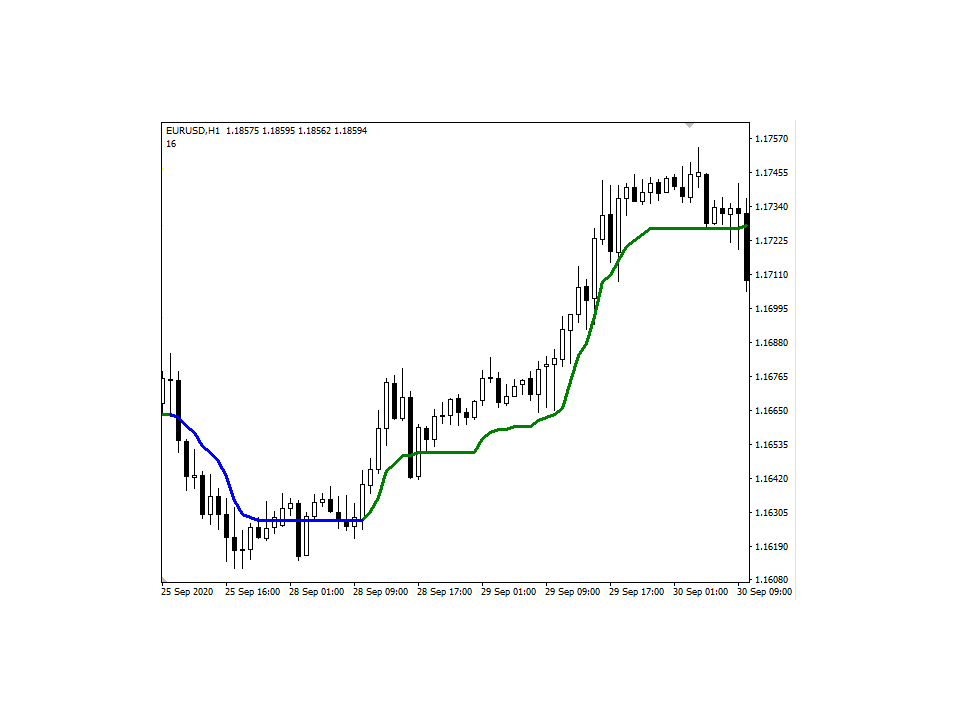
El indicador Practitioner se basa en un algoritmo único para analizar el comportamiento de los precios y presenta el resultado de este complejo trabajo en forma de líneas. Una de las ventajas de este indicador es que cambia automáticamente el color de la línea según la dirección actual del movimiento del precio.
Es importante señalar que el indicador tiene una opción para activar alertas cuando cambia el color de la línea. Esto da al operador la oportunidad de responder rápidamente a los cambios e identificar nuevas tendencias en el mercado.
Utilizando este indicador, un operador puede encontrar más fácilmente operaciones de alta probabilidad en la dirección de las fuertes tendencias del mercado. Esto ayudará a mejorar la precisión de las operaciones de entrada y aumentar el éxito comercial.