KT Raff Channel MT5
- Indicadores
-
KEENBASE SOFTWARE SOLUTIONS
 Keenbase Trading desarrolla indicadores profesionales y Asesores Expertos (Expert Advisors) para MetaTrader 4 y MetaTrader 5, diseñados para ayudar a los traders a tomar decisiones de trading más informadas.
 - Versión: 1.0
- Activaciones: 10
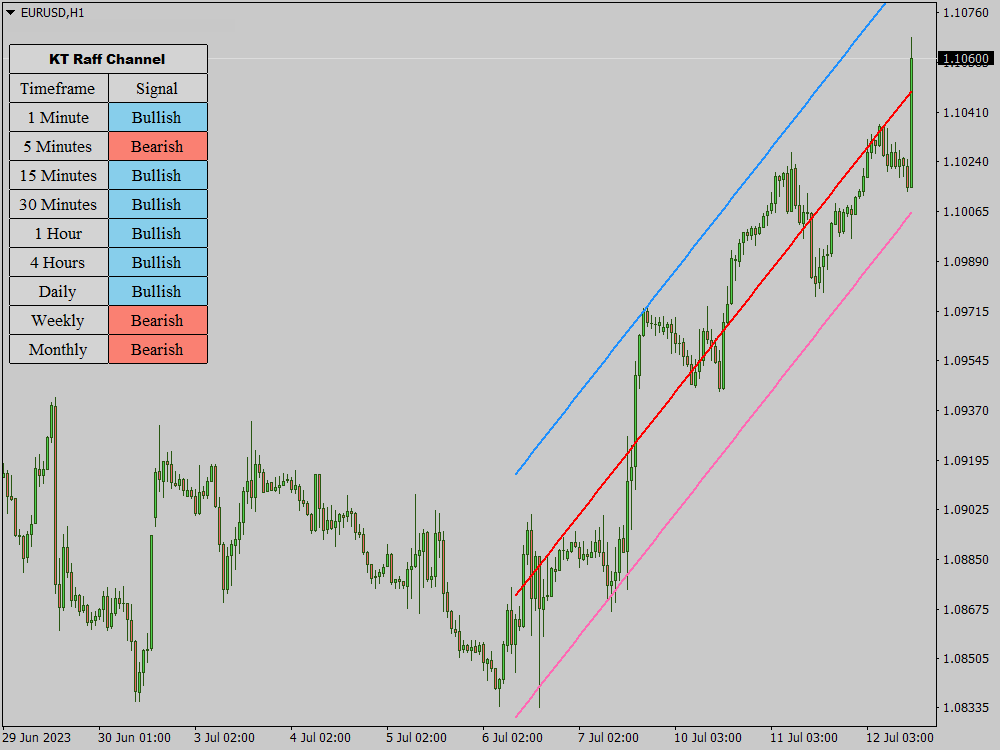
KT Raff Channel es una versión mejorada y refinada del concepto original del canal Raff, desarrollado por Gilbert Raff en 1996. Este indicador amplía el trabajo inicial de Raff, incorporando modificaciones y avances para ofrecer a los traders una herramienta más sofisticada y poderosa.
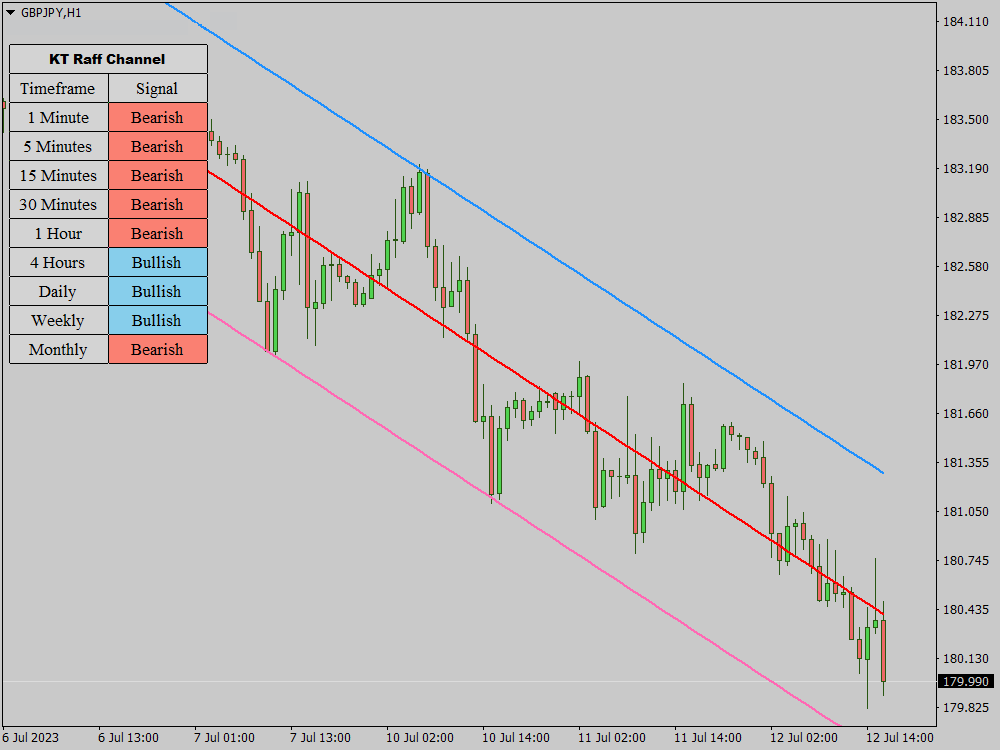
Gilbert Raff, un nombre reconocido en el análisis de mercados financieros, es el creador del Canal de Regresión Raff. Esta herramienta técnica está diseñada para identificar y validar posibles tendencias de precios. Funciona trazando una línea de regresión lineal a través del punto medio de un rango de precios seleccionado y dibujando dos líneas equidistantes a ambos lados de la línea de regresión.
Características
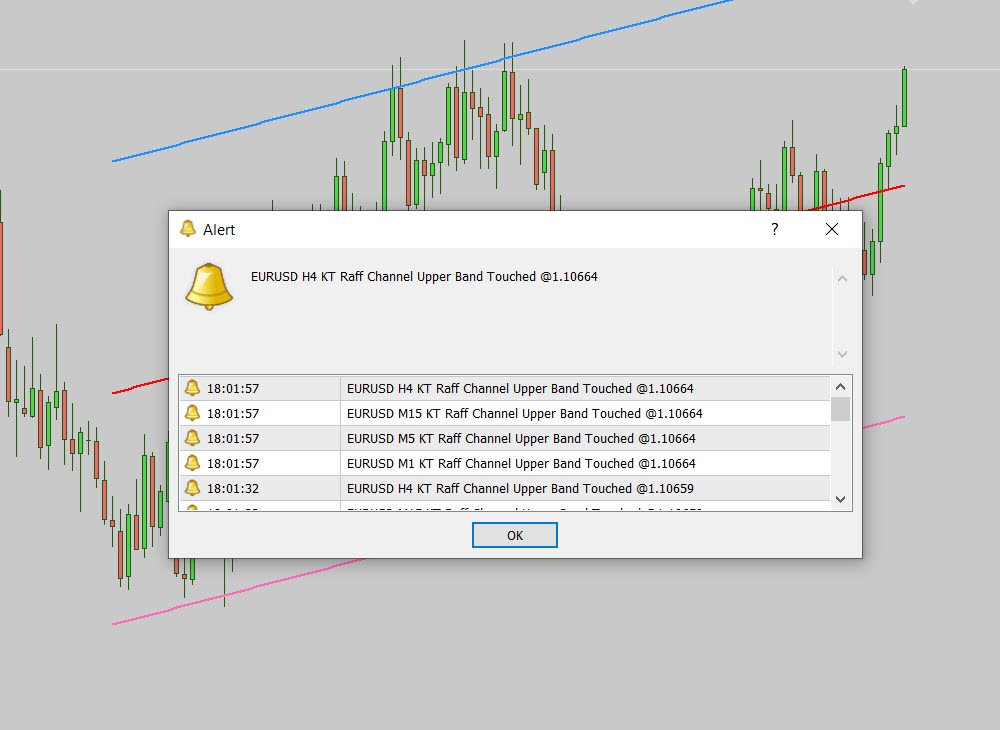
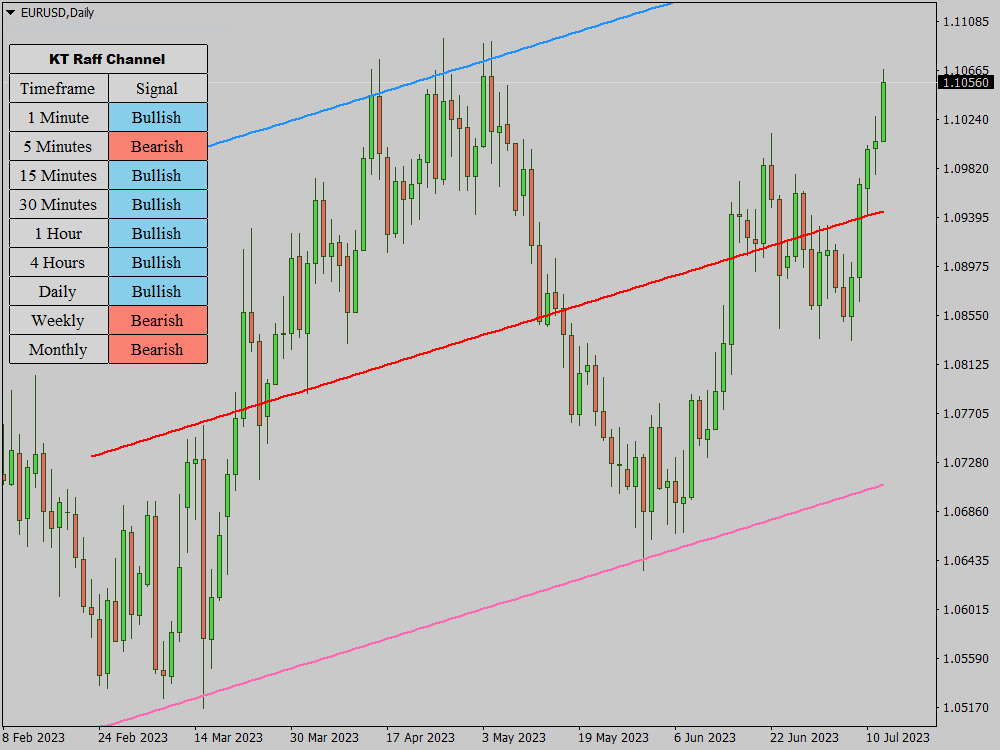
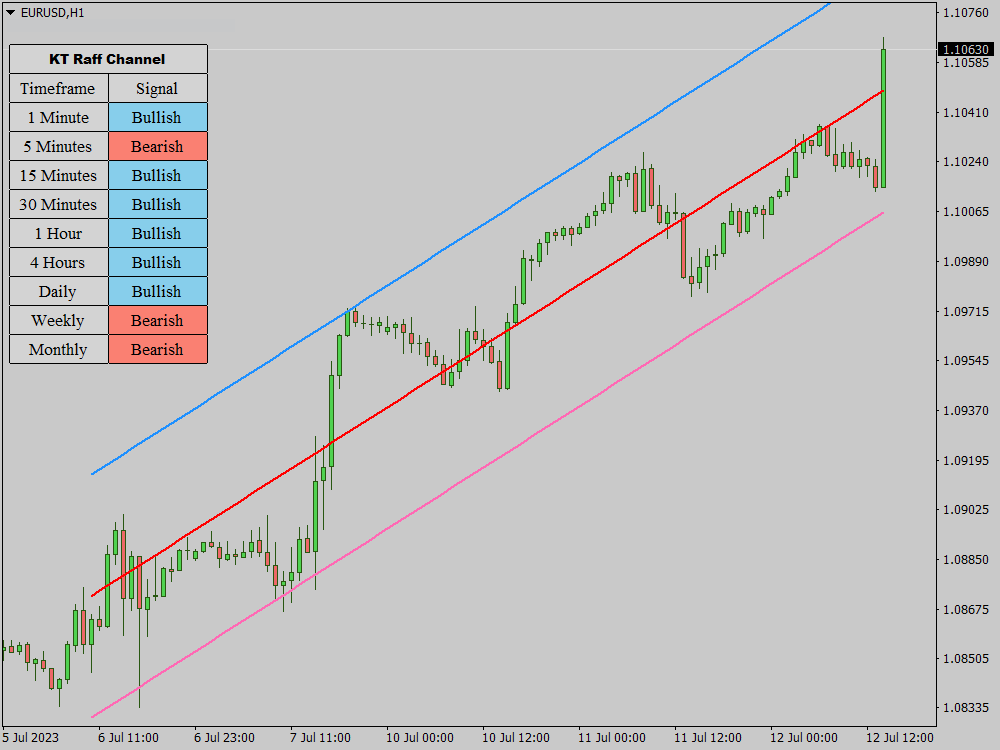
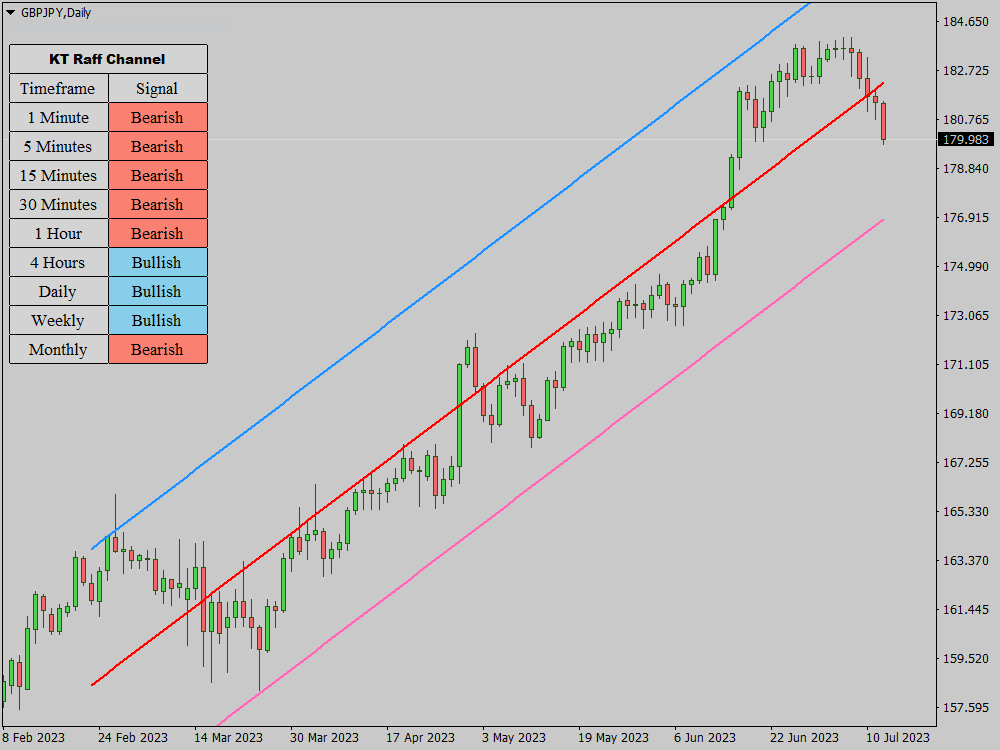
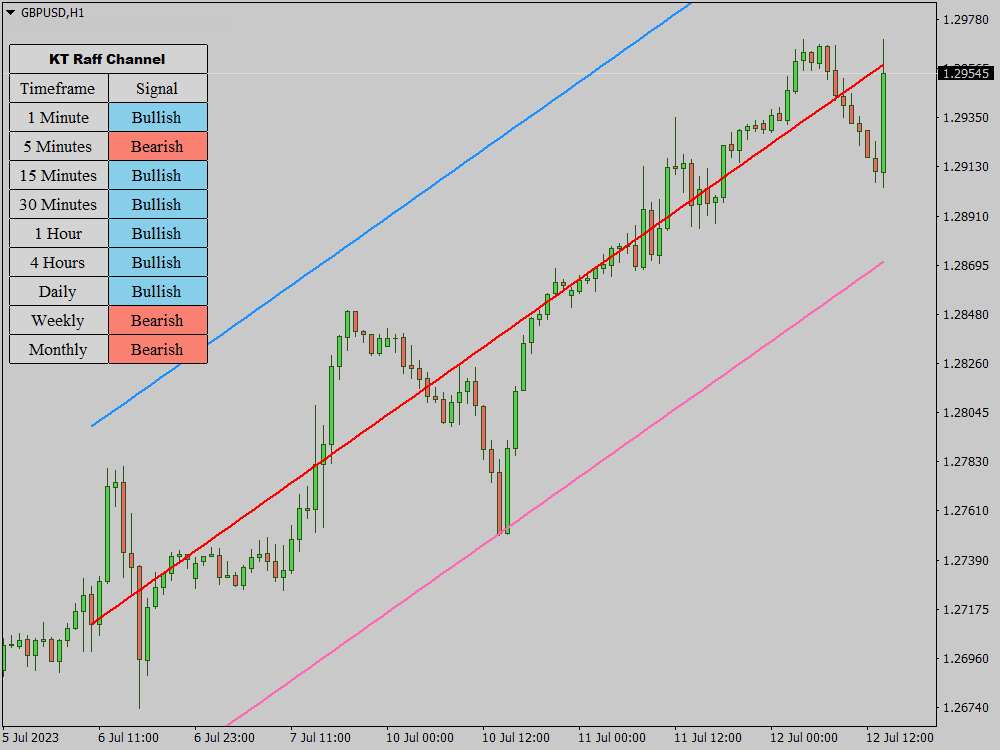
- Ayuda a los traders a identificar y confirmar tendencias del mercado de forma sencilla. Al interpretar la dirección de la línea media, se puede determinar rápidamente si el mercado está en tendencia alcista o bajista.
- Marca los mejores puntos de entrada en los extremos del canal, facilitando la planificación de compras y ventas, optimizando así las ganancias y reduciendo las pérdidas.
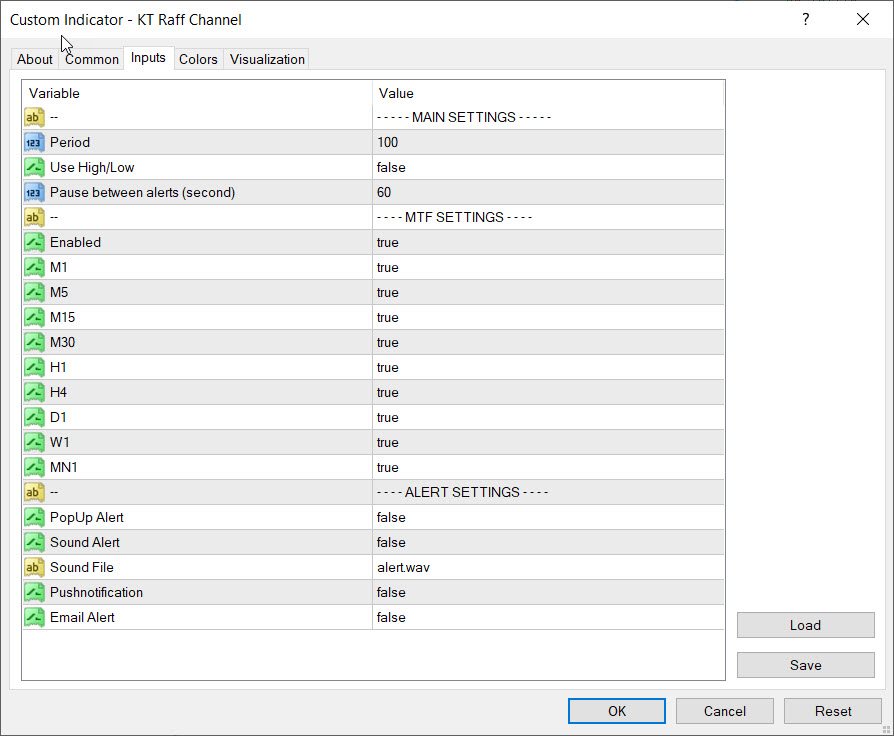
- Funciona en todos los marcos temporales intradía, así como en gráficos diarios, semanales y mensuales. Esta flexibilidad permite adaptarlo tanto a estrategias de corto como de largo plazo.
- No solo es efectivo, sino también fácil de usar, lo que lo hace ideal tanto para traders principiantes como para operadores experimentados que buscan agregar una nueva herramienta a su repertorio.
- Puede combinarse con otros indicadores para fortalecer el análisis de mercado, mejorando así las estrategias de trading y aumentando la tasa de éxito.
Conclusión
KT Raff Channel es un indicador integral de trading de tendencias. Al recomendar entradas en los extremos del canal, proporciona menos operaciones pero más efectivas y exitosas. Cabe destacar que, como cualquier indicador, el canal de regresión Raff no es infalible y debe utilizarse junto con otros métodos de análisis y con indicadores confiables como el Commodity Channel Index (CCI) para validar señales y evitar falsas alertas.
Como siempre, se recomienda probar el indicador en una cuenta demo antes de utilizarlo en los mercados reales.