 MetaTrader 5
 Asesores Expertos
 Indicadores
 Scripts
 Librerías
 Repositorio
Mira cómo descargar robots gratis
¡Búscanos en Facebook!
Pon "Me gusta" y sigue las noticias
Pon "Me gusta" y sigue las noticias
¿Es interesante este script?
Deje un enlace a él, ¡qué los demás también lo valoren!
Deje un enlace a él, ¡qué los demás también lo valoren!
¿Le ha gustado el script?
Evalúe su trabajo en el terminal MetaTrader 5
Evalúe su trabajo en el terminal MetaTrader 5

PositionSizeCalculator - indicador para MetaTrader 5
John John Gutierrez Vivas

Español:
Programador MQL4/MQL5 con experiencia en trading. Desarrollo Expert Advisors, indicadores y herramientas a medida para MetaTrader 4 y 5.
• Convierto tu estrategia en un EA
• Indicadores personalizados y alertas
• Gestores de riesgo y herramientas para cuentas de fondeo
Programador MQL4/MQL5 con experiencia en trading. Desarrollo Expert Advisors, indicadores y herramientas a medida para MetaTrader 4 y 5.
• Convierto tu estrategia en un EA
• Indicadores personalizados y alertas
• Gestores de riesgo y herramientas para cuentas de fondeo
- Visualizaciones:
- 23
- Publicado:
-
 Está perdiendo oportunidades comerciales:
- Aplicaciones de trading gratuitas
- 8 000+ señales para copiar
- Noticias económicas para analizar los mercados financieros
Registro EntradaUsted acepta la política del sitio web y las condiciones de uso
Si no tiene cuenta de usuario, regístrese -
 ¿Necesita un robot o indicador basado en este código? Solicítelo en la bolsa freelance
Pasar a la bolsa
Position Size Calculator - User Guide
Position Size Calculator tells you the exact lot to trade for the risk you choose. You place three lines on the chart (entry, stop loss and take profit), drag them where you want, and the panel shows the lot, the money at risk, the possible profit, the risk/reward ratio and the margin needed. It works on forex, gold, indices and CFDs because it uses the real tick value of each symbol.

1. Installation
- Download PositionSizeCalculator.mq5 and copy it to MQL5\Indicators (in MetaTrader 5: File > Open Data Folder).
- Open it in MetaEditor and press F7 to compile, or restart MetaTrader 5.
- In the Navigator, drag PositionSizeCalculator onto any chart.
2. Quick start
- Attach the indicator. Three lines appear around the current price: entry (gray), stop loss (red) and take profit (green).
- Drag the stop loss line to where your trade idea is wrong, and the take profit line to your target.
- Read the lot size in the panel and use it in your order.
3. The lines
- Buy or sell: stop loss below the entry means a buy, above means a sell. The panel shows BUY or SELL in the header.
- Market entry: by default the entry line follows the market price (Ask for a buy, Bid for a sell). The panel shows MARKET.
- Pending entry: drag the entry line to plan a limit or stop order. The panel shows PENDING and the entry stays where you put it.
- Selecting a line: the lines are selected when they appear, so you can drag them right away. If a line is not selected, double click it.
- Changing the timeframe keeps your lines. Each symbol has its own lines.
4. The panel
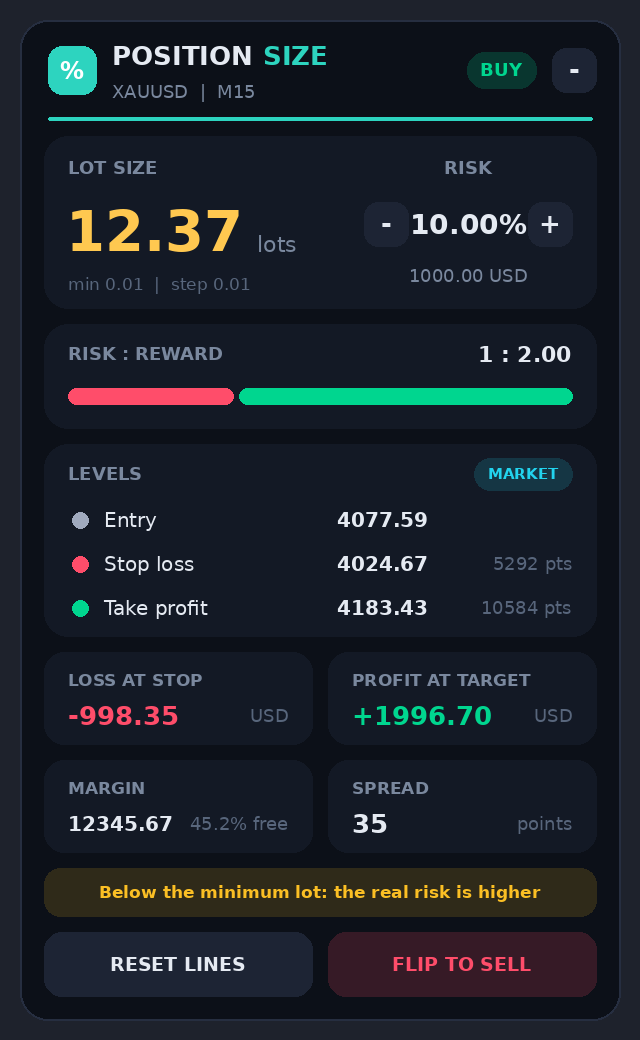
- Header: symbol, timeframe and trade side. Drag the header to move the panel. The - button minimizes it; minimized, it still shows the side and the lot.
- Lot size: the lot for your risk, rounded down to the broker's lot step, with the minimum lot and the step below it.
- Risk: your current risk with - and + buttons to change it without opening the inputs. Below it, the same risk in money.
- Risk : Reward: the ratio between the stop and the target. The red and green bar shows it at a glance.
- Levels: entry, stop loss and take profit prices with their distance in pips (points on symbols like gold or indices).
- Loss at stop / Profit at target: what you lose if the stop is hit and what you make at the target, with the lot shown in the panel and the commission included.
- Margin: margin needed for the lot and the part of your free margin it uses.
- Spread: current spread in points.
- Reset lines: puts the three lines back around the current price and returns the entry to market.
- Flip to sell / Flip to buy: moves the stop loss and the take profit to the other side of the entry, keeping the same distances.
5. Inputs
| Input | What it does | Default |
|---|---|---|
| Risk based on | % of balance, % of equity or a fixed amount of money. | % of balance |
| Risk % | Risk per trade when using a percentage. | 1.0 |
| Fixed money risk | Risk per trade in account currency when using fixed money. | 50 |
| Step of the - / + buttons | How much each click changes the risk %. With fixed money, each click is 10% of the amount. | 0.25 |
| Commission per lot, round turn | Your broker commission for opening and closing 1 lot. It is added to the risk, so the lot is a bit smaller. | 0 |
| First stop distance (x ATR) | Where the stop loss line appears the first time, in multiples of the ATR(14). | 1.5 |
| First take profit (x stop distance) | Where the take profit line appears the first time. | 2.0 |
| Entry / Stop loss / Take profit line | Line colors. | Gray / red / green |
| Text next to the lines | Shows pips, money and lot next to each line. | false |
| Panel side | Left or right side of the chart. | Right |
| Distance from the side / top (px) | Starting position of the panel. | 12 / 30 |
| Panel size | Makes the panel bigger or smaller (1.2 or 1.5 for high resolution screens). | 1.0 |
6. Messages in the panel
| Message | What to do |
|---|---|
| Move the stop loss away from the entry | The stop loss is on the entry. Drag it up or down. |
| No data from the broker: check the connection | The terminal cannot get the tick value. Check that you are connected to your trading account. |
| Balance is zero: log in or use fixed money risk | There is no account balance to calculate a percentage. Log in, or set "Risk based on" to fixed money. |
| Below the minimum lot: the real risk is higher | Your risk is too small for this stop. The panel uses the minimum lot and shows the real loss. Use a closer stop or a bigger risk. |
| The take profit is on the wrong side | Move the take profit to the other side of the entry, or use Flip. |
| Not enough free margin for this lot | Lower the risk or use a wider stop. |
7. Tips
- Always place the stop loss first, where your idea is wrong. Then let the calculator give you the lot. Never move the stop just to trade a bigger lot.
- Use "% of equity" if you usually have open trades, so the risk follows your real account value.
- If your broker charges commission, fill in "Commission per lot" so the loss shown is the real one.
- The lot is always rounded down, so the real risk is never above the one you set (except when the minimum lot is used).
by Ultimate Trading
Session Boxes - Asia, London, New York with Auto GMT
Draws the Asia, London and New York sessions as boxes with their high and low. Broker time zone is detected automatically, with an optional alert when price breaks the Asia range.
 Comprobación previa de la cesta del corredor: diagnóstico de contratos de solo lectura y de volumen mínimo
Script de MT5 de solo lectura para símbolos exactos de Market Watch: reglas de contrato y volumen, antigüedad de las cotizaciones y spread, margen aislado de COMPRA/VENTA, movimientos de precio de un tick y resultados solo del spread en la divisa de la cuenta. Código fuente en MIT; salida en el diario de expertos.
 Margin Risk Simulator
Muestra los precios del símbolo actual en los que la cuenta alcanza el nivel de llamada de margen y el stop out, con un modo de simulación para un volumen adicional, el volumen máximo que se puede añadir y las órdenes pendientes que se activan en el proceso.
VelaMayor MTF - Higher Timeframe Candle Overlay
Superpón velas de marcos temporales superiores directamente sobre tus gráficos de marcos temporales inferiores con rellenos de cuerpo personalizables, bordes independientes y mechas precisas. Detecta sin esfuerzo la tendencia macro, las aperturas de sesión y los rangos de liquidez sin tener que cambiar de pantalla. Motor ultraligero con límites de cuadro separados y una recuperación automática de los cambios en los gráficos totalmente fiable.