Pon "Me gusta" y sigue las noticias
Deje un enlace a él, ¡qué los demás también lo valoren!
Evalúe su trabajo en el terminal MetaTrader 5

Stoch RSI MT4 - indicador para MetaTrader 4

if you're looking for someone to support you even after the job is done then I'm your guy :)
Customer services I offer:
- Source code providing
- Clean coding (self explanatory)
- Reliable programming
- Quick turnaround
- Visualizaciones:
- 51691
- Ranking:
- Publicado:
- Actualizado:
-
 Está perdiendo oportunidades comerciales:
- Aplicaciones de trading gratuitas
- 8 000+ señales para copiar
- Noticias económicas para analizar los mercados financieros
Registro EntradaUsted acepta la política del sitio web y las condiciones de uso
Si no tiene cuenta de usuario, regístrese -
 ¿Necesita un robot o indicador basado en este código? Solicítelo en la bolsa freelance
Pasar a la bolsa
¿Necesita un robot o indicador basado en este código? Solicítelo en la bolsa freelance
Pasar a la bolsa
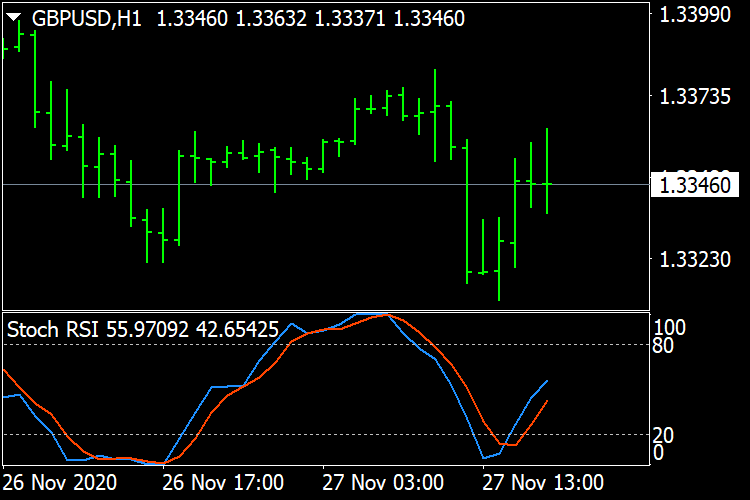
The Stochastic RSI indicator (Stoch RSI) is essentially an indicator of an indicator. It is used in technical analysis to provide a stochastic calculation to the RSI indicator. This means that it is a measure of RSI relative to its own high/low range over a user defined period of time. The Stochastic RSI is an oscillator that calculates a value between 0 and 1 which is then plotted as a line. This indicator is primarily used for identifying overbought and oversold conditions.
 Fibonacci Potential Entry - MT4
The 8 effective steps to build a robust day trading plan using Fibonacci retracement
Doulble MA Cross Draw Histogram
Use the intersection of two moving average lines to draw a vertical line
Identify potential Trends/Range (Pivot Points) - MT4
This script was developed in order to help us detect if a chart is actually trending or going nowhere.
AverageRangeLines_v1.6
ADR,AWR,AMR,Draws Average Range Lines