Pon "Me gusta" y sigue las noticias
Deje un enlace a él, ¡qué los demás también lo valoren!
Evalúe su trabajo en el terminal MetaTrader 5

Swing trading 3 EMA Crossover - indicador para MetaTrader 4

- Visualizaciones:
- 36934
- Ranking:
- Publicado:
- Actualizado:
-
 Está perdiendo oportunidades comerciales:
- Aplicaciones de trading gratuitas
- 8 000+ señales para copiar
- Noticias económicas para analizar los mercados financieros
Registro EntradaUsted acepta la política del sitio web y las condiciones de uso
Si no tiene cuenta de usuario, regístrese -
 ¿Necesita un robot o indicador basado en este código? Solicítelo en la bolsa freelance
Pasar a la bolsa
¿Necesita un robot o indicador basado en este código? Solicítelo en la bolsa freelance
Pasar a la bolsa
There is no magic in moving averages but they can be used to form the basis of a simple trading strategy that works.
For some reason, Forex traders especially enjoy these types of strategies. You can develop many trading systems using averages but remember that complex trading strategies are not always best.
The Triple Moving Averages
As I mentioned, the 3 EMA’s will have different lengths and they will be:
- 9 period EMA
- 21 period EMA
- 55 period EMA
-
-
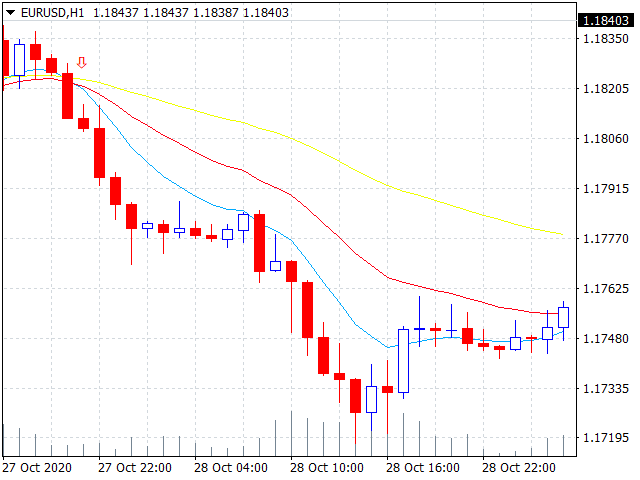
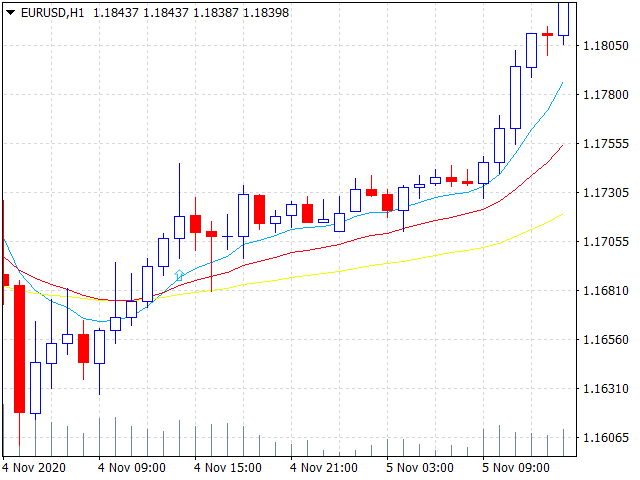
The 55 EMA will be considered the longer term trend direction indicator:
- When the 55 EMA is below both the 9 and 21, we will consider the trend to be up
- When the indicator is above both of the shorter term moving averages, we will consider the longer term trend to be down
The 21 EMA is considered a medium term trend indicator:
- We want to see the 21 below the 9 and above the 55 for an uptrend
- The 21 should be above the 9 and below the 55 for a down trend
The 9 period will be seen crossing over and under the 21 period more times than crossing the 55:
- The 9 EMA crossing over the 21 while already above the 55, is an uptrend and looking for a buy trade
- If it crosses below the 21 while already below the 55, that is a down trend and looking for a sell trade
Visual Trend Indicator
Visual multi-timeframe trend indicator.
 CSV file creating example expert
Example how to use file write function
Doulble MA Cross Draw Histogram
Use the intersection of two moving average lines to draw a vertical line
 Fibonacci Potential Entry - MT4
The 8 effective steps to build a robust day trading plan using Fibonacci retracement