 MetaTrader 5
 Experts
 Indicators
 Scripts
 Libraries
 Storage
Watch how to download trading robots for free
Find us on Facebook!
Join our fan page
Join our fan page
You liked the script? Try it in the MetaTrader 5 terminal

Volatility quality - indicator for MetaTrader 5

- Views:
- 15137
- Rating:
- Published:
- Updated:
-
 You are missing trading opportunities:
- Free trading apps
- Over 8,000 signals for copying
- Economic news for exploring financial markets
Registration Log inYou agree to website policy and terms of use
If you do not have an account, please register -
 Need a robot or indicator based on this code? Order it on Freelance
Go to Freelance
Theory:
Originally volatility quality was invented by Thomas Stridsman, and he uses it in combination of two averages (original was published, with some more explanation, here: Volatility quality Stridsman).
This version:
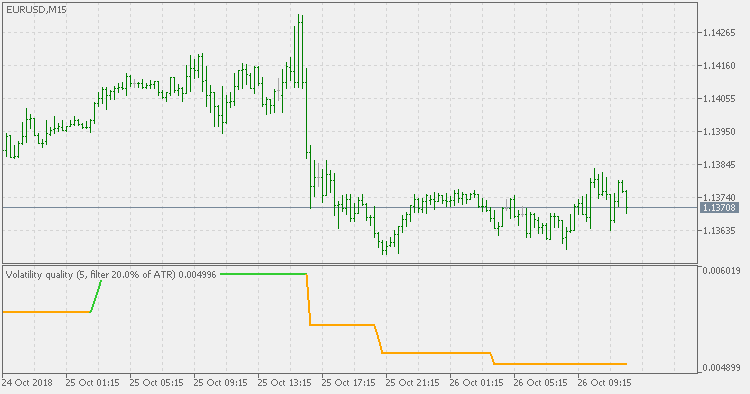
It is not using averages for trend estimation, but is using the slope of the Volatility quality. In order to lessen the number of signals (which can be enormous if the VQ is not filtered), some versions similar to this are using pips filters. This version is using % of ATR (Average True Range) instead. The reason for that is that:
- using fixed pips value as a filter will work on one symbol and will not work on another
- changing time frames will render the filter worthless since the ranges of higher time frames are much greater than those at lower time frames, and, when you set your filter on one time frame and then try it on another, it is almost certain that it will have to be adjusted again
- to avoid that this indicator is using ATR % for filtering and that automatically adjusts it to symbols and time frames
Usage:
You can use the color change as signals when using this indicator.
Nonlinear Kalman filter deviation
Nonlinear Kalman filter deviation
Inertia_Candles
The indicator paints candles whose body sizes exceed the indicator input parameter in points
Volatility quality - zero line
Volatility quality - zero line and ATR based
Stripped T3 levels
Stripped T3 levels (T3 levels that can display the 3 phases of T3 calculation)