Pon "Me gusta" y sigue las noticias
Deje un enlace a él, ¡qué los demás también lo valoren!
Evalúe su trabajo en el terminal MetaTrader 5

The Turtle Trading Channel - indicador para MetaTrader 4

- Visualizaciones:
- 126756
- Ranking:
- Publicado:
- Actualizado:
-
 Está perdiendo oportunidades comerciales:
- Aplicaciones de trading gratuitas
- 8 000+ señales para copiar
- Noticias económicas para analizar los mercados financieros
Registro EntradaUsted acepta la política del sitio web y las condiciones de uso
Si no tiene cuenta de usuario, regístrese -
 ¿Necesita un robot o indicador basado en este código? Solicítelo en la bolsa freelance
Pasar a la bolsa
¿Necesita un robot o indicador basado en este código? Solicítelo en la bolsa freelance
Pasar a la bolsa
This trend following system was designed by Dennis Gartman and Bill Eckhart, and relies on breakouts of historical highs and lows to take and close trades: it is the complete opposite to the "buy low and sell high" approach. This trend following system was taught to a group of average and normal individuals, and almost everyone turned into a profitable trader.
The main rule is "Trade an N-day breakout and take profits when an M-day high or low is breached (N must me above M)". Examples:
- Buy a 10-day breakout and close the trade when price action reaches a 5-day low.
- Go short a 20-day breakout and close the trade when price action reaches a 10-day high.
In this indicator, the red and blue lines are the trading lines, and the dotted line is the exit line. Original system is:
- Go long when the trading line turns blue
- Go short when the trading line turns red
- Exit long positions when the price touches the exit line
- Exit short positions when the price touches the exit line
Recommended initial stop-loss is ATR * 2 from the opening price. Default system parameters were 20,10 and 55,20.
I have, however, altered a little bit the algorithm to get early entry signals and avoid random trend swings in highly volatile conditions. To do so, this indicator will only show a trend change when a bar actually closes above or below the current trendline -instead of just touching it like a normal stop-loss order would do-. The downside is that you can only detect trend changes when the last bar has already closed. Just in case, the strict version is also available.
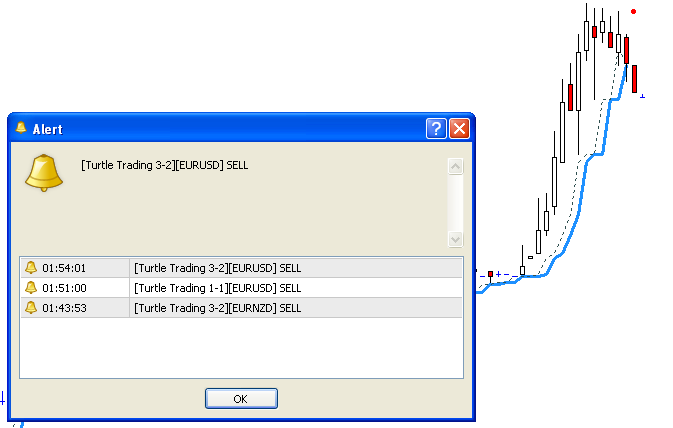
This indicator should be used together with my other indicator: The classic Turtle Trading Indicator, to represent the same period or the failsafe trading system and get further signals if you have been stopped out. Both indicators implement trading alerts, enable or disable them at will depending on your trading setup.
Original Turtle Rules:
To trade exactly like the turtles did, you need to set up two indicators representing the main and the failsafe system.
- Set up the main indicator with TradePeriod = 20 and StopPeriod = 10 (A.k.a S1)
- Set up the failsafe indicator with TradePeriod = 55 and StopPeriod = 20 using a different color. (A.k.a S2)
The entry strategy using S1 is as follows
- Buy 20-day breakouts using S1 only if last signaled trade was a loss.
- Sell 20-day breakouts using S1 only if last signaled trade was a loss.
- If last signaled trade by S1 was a win, you shouldn't trade -Irregardless of the direction or if you traded last signal it or not-
The entry strategy using S2 is as follows:
- Buy 55-day breakouts only if you ignored last S1 signal and the market is rallying without you
- Sell 55-day breakouts only if you ignored last S1 signal and the market is pluging without you
The turtles had a progressive position sizing approach that boosted their winnings. Once a trading decision has been made you should...
- Enter the market with 2% risk. Place stop-loss 2ATR from the opening price.
- If the position moves in your favor 1/2ATR, enter the market again with 2% risk and trail all stop-losses 2ATR from current price.
- If the position moves in your favor 1/2ATR, enter the market again with 2% risk and trail all stop-losses 2ATR from current price.
- If the position moves in your favor 1/2ATR, enter the market again with 2% risk and trail all stop-losses 2ATR from current price.
- Stop adding to positions when 4 positions have been taken. (*** And see money management rule below)
The exit strategy is performed using the dotted line of the indicator:
- Exit longs taken using S1 when price action closes below a 10-day low
- Exit shorts taken using S1 when price action closes above a 10-day high
- Exit longs taken using S2 when price action closes below a 20-day low
- Exit shorts taken using S2 when price action closes avove a 20-day high
The turtles had very strict money management too. Initial position risk was 2%, but it decreased according to the current drawdown.
- If the account had a 10% drawdown, the risk for each trade should decrease a 20%
- If the account had a 20% drawdown, the risk for each trade should decrease a 40%.
- If the account had a 30% drawdown, the risk for each trade should decrease a 60%.
- So, if the account had a N% drawdown, the risk for each trade should decrease N*2%.
Other considerations:
- Don't get too fixated to the 20,10 (S1) and 55,20 (S1) parameters
- The TradePeriod must always be higher than StopPeriod
Changelog:
- 2012-05-17: Added alerts, fixed an important bug and attached a raw version displaying both channels.
- 2012-06-12: Updated the indicator enabling the strict mode from the same file.
Session Open V-Line Indi
Draws a Vertical Line at Session Open - Eurozone/London - USA - Asia.
Heiken Ashi Histogram
Another suggested way to track Heiken Ashi candles and trading short-term price swings
 Correct Gann fan
A set of scripts to install and work with Gann fan. Custom fan has correct angles and is scale insensitive.
The classic Turtle Trading Indicator
This is classic implementation of the Turtle Trading system, with clear entry/exits signals within the same trend and enter/exit alerts. It should be used together with my other indicator, The Turtle Trading Channel to get further entry signals if you h