Market Condition Evaluation based on standard indicators in Metatrader 5 - page 171
You are missing trading opportunities:
- Free trading apps
- Over 8,000 signals for copying
- Economic news for exploring financial markets
Registration
Log in
You agree to website policy and terms of use
If you do not have an account, please register
Forum on trading, automated trading systems and testing trading strategies
Forecast for Q2'16 - levels for Hang Seng Index (HSI)
Sergey Golubev, 2016.05.02 14:31
Quick Technical Overview - Hang Seng Index: ranging near 200-day SMA waiting for direction of the trend
Daily price is on bullish ranging near 200-day SMA 'reversal' level waiting for direction:
Forum on trading, automated trading systems and testing trading strategies
Press review
Sergey Golubev, 2016.05.03 08:55
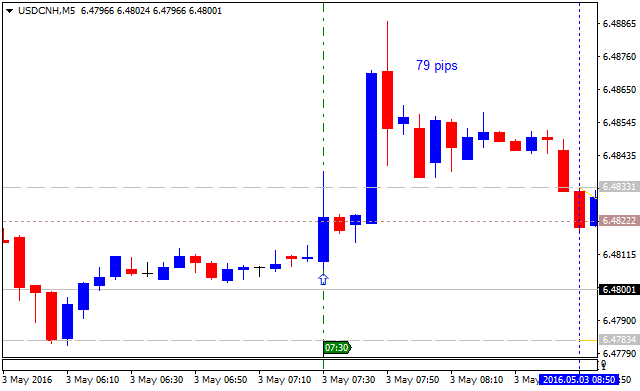
Intra-Day Fundamentals - Reserve Bank of Australia Cash Rate: 79 pips for USD/CNH and 141 pips for AUD/USD
2016-05-03 04:30 GMT | [AUD - RBA Cash Rate]
if actual > forecast (or previous one) = good for currency (for AUD in our case)
[AUD - RBA Cash Rate] = Interest rate charged on overnight loans between financial intermediaries.
==========
==========
AUD/USD M5: 141 pips price movement by RBA Cash Rate news event :
USD/CNH M5: 79 pips price movement by RBA Cash Rate news event :
Forum on trading, automated trading systems and testing trading strategies
Press review
Sergey Golubev, 2016.05.03 10:42
GBP/USD Intra-Day Fundamentals: U.K. Manufacturing PMI and 33 pips price movement
2016-05-03 08:30 GMT | [GBP - Manufacturing PMI]
if actual > forecast (or previous one) = good for currency (for GBP in our case)
[GBP - Manufacturing PMI] = Level of a diffusion index based on surveyed purchasing managers in the manufacturing industry.
==========
==========
GBP/USD M5: 33 pips price movement by U.K. Manufacturing PMI news event :
Forum on trading, automated trading systems and testing trading strategies
Forecast for Q2'16 - levels for DAX Index
Sergey Golubev, 2016.05.03 15:43
Quick Technical Overview - DAX Index: secondary correction within the primary bullish; waiting for breakdown
Daily price is on secondary correction within the primary bullish market condition: the price was started with the local downtrend in the end of April this year.
If daily price will break 10,055.8 support level on close bar so the secondary correction will be continuing.
If not so the price will be on ranging bullish condition within the levels.
Forum on trading, automated trading systems and testing trading strategies
Press review
Sergey Golubev, 2016.05.04 08:53
NZD/USD Intra-Day Fundamentals: NZ Unemployment Rate and 36 pips price movement
2016-05-03 22:45 GMT | [NZD - Unemployment Rate]
if actual < forecast (or previous one) = good for currency (for NZD in our case)
[NZD - Unemployment Rate] = Percentage of total work force that is unemployed and actively seeking employment during the previous quarter.
==========
==========
NZD/USD M5: 36 pips price movement by NZ Unemployment Rate news event :
Forum on trading, automated trading systems and testing trading strategies
Forecast for Q2'16 - levels for Brent Crude Oil
Sergey Golubev, 2016.05.04 13:14
Technical Analysis for Brent Crude Oil: intra-day bearish breakdown with secondary ranging; daily correction
H4 price is on breakdown with the bearish reversal: the price broke key support levels together with Senkou Span line to below for the reversal of the price movement from the primary bullish to the ranging bearish market condition.
If H4 price will break 44.24 support level on close bar so the bearish breakdown will be continuing without secondary ranging: the price will be fully reversed to the primary bearish market condition.
If H4 price will break 46.37 resistance level so the price will be reversed from the ranging bearish to the ranging bullish condition.
If H4 price will break 48.25 resistance level so the price will be reversed back to the primary bullish market condition to be out of the secondary ranging area.
If not so the price will be ranging within the levels.
-
D1 price is on bullish condition located to be above Ichimoku cloud with the secondary correction to be started in the beginning of this month.
If D1 price will break 44.24 support level on close bar so the secondary correction within the primary bullish trend will be continuing.
-If D1 price will break 37.25 support level so the reversal of the price movement from the ranging bullish to the primary bearish market condition will be started.
If D1 price will break 48.25 resistance level so the primary bullish trend will be continuing.
If not so the price will be ranging within the levels.
Forum on trading, automated trading systems and testing trading strategies
Press review
Sergey Golubev, 2016.05.04 13:36
Trading the News: ISM Non-Manufacturing (based on the article)What’s Expected:
Why Is This Event Important:
Despite the ongoing 9 to1 split within the Federal Open Market Committee, Chair Janet Yellen and Co. may come under increased pressure to further normalize monetary policy at the next quarterly meeting June especially as the U.S. economy approaches ‘full-employment.’
How To Trade This Event Risk
Bullish USD Trade: ISM Non-Manufacturing Survey Climbs to 54.8 or Higher
- Need red, five-minute candle following the print to consider a short trade on EUR/USD.
- If market reaction favors a bullish dollar trade, sell EUR/USD with two separate position.
- Set stop at the near-by swing high/reasonable distance from entry; look for at least 1:1 risk-to-reward.
- Move stop to entry on remaining position once initial target is hit; set reasonable limit.
Bearish USD Trade: Gauge for Service-Based Activity Disappoints- Need green, five-minute candle to favor a long EUR/USD trade.
- Implement same setup as the bullish dollar trade, just in the opposite direction.
Potential Price Targets For The ReleaseEURUSD Daily
Forum on trading, automated trading systems and testing trading strategies
Press review
Sergey Golubev, 2016.05.05 07:43
AUD/USD Intra-Day Fundamentals: Australian Trade Balance and 19 pips price movement
2016-05-05 01:30 GMT | [AUD - Trade Balance]
if actual > forecast (or previous one) = good for currency (for AUD in our case)
[AUD - Trade Balance] = Difference in value between imported and exported goods and services during the reported month.
==========
==========
AUD/USD M5: 19 pips price movement by Australian Trade Balance news event :
Forum on trading, automated trading systems and testing trading strategies
Forecast for Q2'16 - levels for EUR/USD
Sergey Golubev, 2016.05.05 15:05
New daily support/resistance levels was formed for now:
The bearish 'reversal' level is 1.1295, and of the price breaks this level so the reversal of the price movement from the primary bullish to the primary bearish market condition will be started.
Forum on trading, automated trading systems and testing trading strategies
Press review
Sergey Golubev, 2016.05.06 06:17
Crude Oil Forecast: daily bullish reversal, weekly bear market rally (based on the article)
"The Support Zone in focus after Thursday’s blast-off is the Wednesday low at $43.20. Wednesday's low is above the next level of support by ~$0.70 barrel at $42.48, which is the April 26 low that printed before pushing up to $46.75 to close the month. Below $42.48, there could be a quick drop to the 200-DMA, which would take a strong move lower down to ~$40/bbl. Given the significance of the Intermarket factors that have shifted since Oil broke above $40/ 200-DMA, only a move below there would change my bullish model."