Market Condition Evaluation based on standard indicators in Metatrader 5 - page 159
You are missing trading opportunities:
- Free trading apps
- Over 8,000 signals for copying
- Economic news for exploring financial markets
Registration
Log in
You agree to website policy and terms of use
If you do not have an account, please register
Forecast for Tomorrow - levels for EUR/USD, GBP/USD, USD/JPY
EUR/USD: intra-day breakout. This pair is on bullish intra-day breakout for H4 timeframe: price broke key resistance levels on the way to uptrend and it was bounced from 1.1342 resistance level. Chinkou Span line is located to be above the price indicating the intra-day breakout to be continuing. If the price breaks 1.1342 resistance to above so the primary bullish trend will be re-started, otherwise - ranging bullish.
GBP/USD: bullish breakout with 1.4481 resistance to be broken for the breakout to be continuing. The intra-day price (H4) for this pair is on very similar situation with EURUSD: intra-day breakout. The price was bounced from 1.4481 level on the way to uptrend. Absolute Strength indicator is estimating the bullish trend, and Chinkou Span line is indicating the breakout to be continuing in the near future.
USD/JPY: ranging bearish. Intra-day price (H4) is located to be below Ichimoku cloud for the primary bearish market condition: the price is started to be ranging within 110.66 support and 112.22 resistance levels. Absolute Strength indicator is estimating for the bearish trend to be continuing, and Chinkou Span line is indicating the ranging bearish condition in the near future.
Crude Oil Long-Term Technical Analysis: ranging within key bearish levels
The price is located below 100 period SMA (100-SMA) and 200 period SMA (200-SMA) for the primary bearish market condition for the ranging within the following support/resistance levels:
RSI indicator is estimating the secondary bear market rally to be started.
Forum on trading, automated trading systems and testing trading strategies
Press review
Sergey Golubev, 2016.03.18 06:05
Fundamentals Analysis: UoM Consumer Sentiment forecast by Skandinaviska Enskilda Banken AB (adapted from the article)
2016-03-18 14:00 GMT | [USD - UoM Consumer Sentiment]
if actual > forecast (or previous one) = good for currency (for USD in our case)
[USD - UoM Consumer Sentiment] = Level of a composite index based on surveyed consumers.
==========
==========
Forum on trading, automated trading systems and testing trading strategies
Press review
Sergey Golubev, 2016.03.18 15:19
EUR/USD Intra-Day Fundamentals: UoM Consumer Sentiment and 11 pips range price movement
2016-03-18 14:00 GMT | [USD - UoM Consumer Sentiment]
if actual > forecast (or previous one) = good for currency (for USD in our case)
[USD - UoM Consumer Sentiment] = Level of a composite index based on surveyed consumers.
==========
==========
EURUSD M5: 11 pips range price movement by UoM Consumer Sentiment news event :
Forum on trading, automated trading systems and testing trading strategies
Forecast for Q1'16 - levels for GOLD (XAU/USD)
Sergey Golubev, 2016.03.18 19:48
GOLD (XAU/USD): End Of Week Technicals - ranging within bullish resistance level and the bearish reversal support level
Daily price is above 100-day SMA/200-day SMA area for the bullish market condition with the ranging within the following key support/resistance levels:
RSI indicator is estimating the ranging bullish trend to be continuing.
If the price breaks 1144.75 support level so the reversal of the price movement from the primary bullish to the primary bearish market condition will be started.
If the price breaks 1283.35 resistance level to above on close daily bar so the bullish trend will be continuing.
If not so the price will be ranging within the levels.
SUMMARY : bullish
TREND : rangingForum on trading, automated trading systems and testing trading strategies
Forecast for Q1'16 - levels for GOLD (XAU/USD)
Sergey Golubev, 2016.03.21 08:14
GOLD (XAU/USD) Technical Analysis 2016, 20.03 - 27.03: ranging to correction
Daily price is on primary bullish market condition located above Ichimoku cloud and above Senkou Span line which is the virtual border between the primary bearish and the primary bullish trend on the chart. The price is ranging within the following key support/resistance lines:
Chinkou Span line is crossing the price to below on open daily bar for the possible daily breakdown to be started, Trend Strength indicator is estimating the secondary correction in the nexr future, and Absolute Strange indicator is evaluating the ranging trend to be continuing.
If D1 price will break 1225.60 support level on close bar so the secondary correction within the primary bullish market condition will be started.
If D1 price will break 1190.80 support level on close bar from above to below so we may see the reversal of the price movement from the primary bullish to the primary bearish condition with the secondary ranging.
If D1 price will break 1283.35 resistance level on close bar so the bullish trend will be continuing.
If not so the price will be on ranging within the levels.
SUMMARY : ranging
TREND : bullishForum on trading, automated trading systems and testing trading strategies
Press review
Sergey Golubev, 2016.03.22 08:38
Trading News Events: U.K. Consumer Price Index (based on the article)
What’s Expected:
Why Is This Event Important:
The BoE looks poised to retain its current policy ahead of the U.K. Referendum in June as the Monetary Policy Committee (MPC) remains unanimous in keeping the benchmark interest rate at the record-low, but signs of stronger price growth may encourage Governor Mark Carney to adopt a more hawkish tone over the coming months as the central bank sees a risk of overshooting the 2% inflation-target over the policy horizon.
Nevertheless, waning confidence paired with fears surrounding the U.K. Referendum may drag on inflation, and signs of easing price growth may produce near-term headwinds for the sterling as market participants push out bets for a BoE rate-hike.
How To Trade This Event Risk
Bullish GBP Trade: Headline & Core Inflation Meet/Beat Market Forecast
- Need red, five-minute candle following the print to consider a short GBP/USD trade.
- If market reaction favors selling sterling, short GBP/USD with two separate position.
- Set stop at the near-by swing high/reasonable distance from entry; look for at least 1:1 risk-to-reward.
- Move stop to entry on remaining position once initial target is hit, set reasonable limit.
Bearish GBP Trade: U.K. CPI Report Disappoints- Need green, five-minute candle to favor a long GBP/USD trade.
- Implement same setup as the bearish British Pound trade, just in reverse.
Potential Price Targets For The ReleaseGBPUSD Daily
Forum on trading, automated trading systems and testing trading strategies
Press review
Sergey Golubev, 2016.03.22 10:57
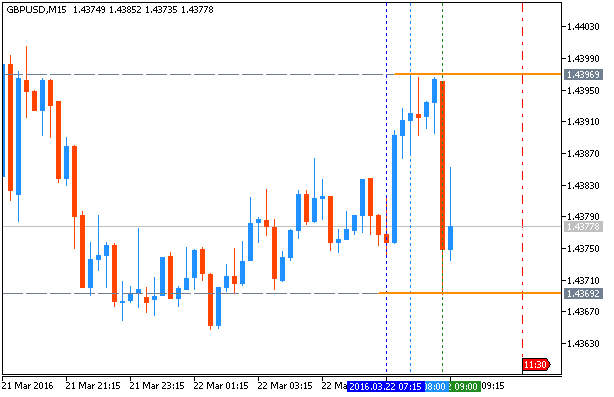
GBP/USD Intra-Day Fundamentals: U.K. Consumer Price Index and 42 pips price movement
2016-03-22 09:30 GMT | [GBP - CPI]
if actual > forecast (or previous one) = good for currency (for GBP in our case)
[GBP - CPI] = Change in the price of goods and services purchased by consumers.
==========
==========
GBPUSD M5: 42 pips price movement by U.K. Consumer Price Index news event :
Forum on trading, automated trading systems and testing trading strategies
Forecast for Q1'16 - levels for GBP/USD
Sergey Golubev, 2016.03.22 17:57
Quick Technical Overview - Sell GBP: intra-day price is breaking 1.42 support for the bearish reversal
GBP/USD: possible intra-day bearish reversal. H4 price broke Ichimoku cloud and it was stopped by 1.4203 key bearish support level. if the price breaks this level to below so the bearish reversal will be started up to 1.4052 bearish target. Absolute Strength indicator is estimating the bearish condition to be started, and Chinkou Span line came to be very close to the price for the good possible breakdown in the near future for example.
There are the following news events which will be affected on GBP/USD price movement for the week:
Forum on trading, automated trading systems and testing trading strategies
Press review
Sergey Golubev, 2016.03.23 07:23
Technical Targets for GBP/USD by United Overseas Bank (based on the article)
GBP/USD: ranging bearish within 1.40/1.45 area
Daily price is located below 100 period SMA and 200 period SMA for the primary bearish market condition with the secondary ranging within 1.4052 support level and 1.4535 resistance level.
RSI indicator is estimating the secondary ranging to be continuing.