Errors, bugs, questions - page 2099
You are missing trading opportunities:
- Free trading apps
- Over 8,000 signals for copying
- Economic news for exploring financial markets
Registration
Log in
You agree to website policy and terms of use
If you do not have an account, please register
Guys, I'm sick and tired of entering my username and password from www.mql5.com in android in mt5.
Why do they keep losing their username and password?
I also get asked regularly, but I don't enter my username/password, I just press the Back button and it turns out to be logged in.
Why is a very useful function like ChartXYToTimePrice() so expensive in execution time?
I wrote a function analogous to XYToTimePrice() and it runs much faster. Up to several hundred times faster.
But there is also ChartID_in with SubWindow_out in the original function. Make a full analogue.
So there's also ChartID_in with SubWindow_out in the original. Make a full analogue.
Adding ChartID_in and SubWindow_out is not difficult at all. But I'm not aiming to create a full analogue, I just created this function to show slowness of ChartXYToTimePrice().
But it's true, my function needs additional parameter event id. And so far, this function works more or less equally with the original one pixel candle thickness, but you can improve it, if necessary.
Adding ChartID_in and SubWindow_out is not difficult at all. But I'm not aiming to create a full analogue, I just created this function to show slowness of ChartXYToTimePrice().
But it's true, my function needs additional parameter event id. And while this function works more or less the same with original one pixel candle thickness, but you can improve it, if necessary.
And I have also noticed a strange feature of ChartXYToTimePrice. Its execution time is directly proportional to the number of bars on the chart.
This indicates a "strange" algorithm for its calculation. Namely, it is a cyclic summation which is quite strange for the optimal solution of such a problem.
The speed of the XYToTimePrice function is the same regardless of the number of bars.
And to be honest, the speed of the ChartGetInteger and ChartGetDouble functions is also clearly overestimated and has very strange features. For example, the function
is 20-100 times faster than the function
if MAX is after MIN:
but if you swap them around, the situation is reversed.
I.e. it seems logical - the same function, which is calculated repeatedly, uses already calculated and stored data from a previous function call. But it just shows some crazy calculations and creation of a lot of intermediate data and maybe even arrays to calculate a simple double value of maximum (or minimum) chart price, which probably already sits in some variable and just needs to be taken.
Although I do not exclude that this effect occurs due to some peculiarities of profiling and is of fake nature. But the sluggishness of these functions is not fake.
it can be refined, if necessary.
It is probably still valid to say that it is correct to compare the speed characteristics of the two functions when their results coincide. Please complete it.
Guys, I'm tired of entering my username and password from www.mql5.com on android in mt5.
Why are they constantly losing their username and password?
Write to servicedesk. Please attach the logs. I'm sorry. Thank you.
Forum on trading, automated trading systems and trading strategy testing
Bugs, bugs, questions
fxsaber, 2017.10.04 09:13
It's been written about this many times. Not corrected for some reason.
I also noticed a strange feature of ChartXYToTimePrice. Its execution time is directly proportional to the number of bars on the chart.
This shows the "weirdness" of its calculation algorithm. Namely, it is a cyclic summation which is quite strange for the optimal solution of such a problem.
The speed of the XYToTimePrice function is the same regardless of the number of bars.
And to be honest, the speed of the ChartGetInteger and ChartGetDouble functions is also clearly overestimated and has very strange features. For example, the function
is 20-100 times faster than the function
if MAX is after MIN:
but if you swap them around, the situation is reversed.
I.e. it seems logical - the same function, which is calculated repeatedly, uses already calculated and stored data from a previous function call. But it just shows some crazy calculations and creation of a lot of intermediate data and maybe even arrays to calculate a simple double value of maximum (or minimum) chart price, which probably already sits in some variable and just needs to be taken.
Although I do not exclude that this effect occurs due to some peculiarities of profiling and is of fake nature. But the sluggishness of these functions is not fake.
The sluggishness of the chart data request functions lies in the way the information is sent and received, not in the implementation itself. The implementation of these functions itself is primitive and does not depend on the number of bars on the chart.
But since the chart is an object the information from which is distributed among many sources, the whole control is based on message queues. Until the previous request is processed, the next one waits.
But if you have several requests for the same graph in a row, then these subsequent requests are executed very quickly. This is because no one has had time to cut in between them and the first request.
The bottleneck of the chart data request functions lies in the way the information is sent and received, not in the implementation itself. The implementation of these functions itself is primitive and does not depend on the number of bars on the chart.
But since the chart is an object the information from which is distributed among many sources, the whole control is based on message queues. Until the previous request is processed, the next one is waiting.
But if you have several requests for the same graph in a row, then these subsequent requests are executed very quickly. This is because no one has had time to cut in between them and the first query.
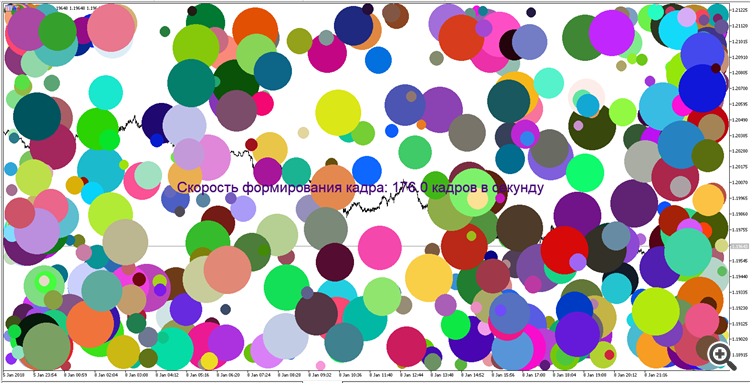
So be it. But the realization of this does not make it any easier. Slava, don't misunderstand a simple programmer. My example of a test indicator from previous messages clearly shows that the average runtime of aChartXYToTimePrice() requestis 5000 - 10000 microseconds (at the thickness of a candle of 1 pixel and the standard MT window on the FullHD screen). What can be done in such time?
Well, for example, during this time you can form an image in the same screen of 500 shaded circles and display them on the screen:
Even if there is a queue, but why is there such a long queue?
On one side of the scale there is a pixel-by-pixel generation of 500 circles with their output on the screen, and on the other side there is a simple query for two digits. And it weighs the same.
A simple programmer sits there, scratching his head and can't put the puzzles together.
So be it. But realizing that doesn't make it any easier. Slava, don't misunderstand a simple programmer. My example of a test indicator from previous messages clearly shows that the average execution time ofChartXYToTimePrice() requestis 5000 - 10000 microseconds ( at a candle width of 1 pixel and MT standard window on FullHD screen). What can be done in such time?
Well, for example, during this time it is possible to form an image in the same screen of 500 shaded circles and display them on the screen:
Even if there is a queue, but why is there such a long queue?
On one side of the scale it is a pixel-by-pixel formation of 500 circles and displaying them on the screen, and on the other side a simple two-digit query. And it weighs the same.
A simple programmer sits and scratches his head and can't put the puzzles together.
You have sensed the difference between synchronous command and asynchronous command.