over bougt/over sold levels
There are many indicators providing overbought/oversold levels, and you can select them in CodeBase.
============
You can look at the following indicators for example:
- Schaff Trend Cycle - indicator for MetaTrader 5
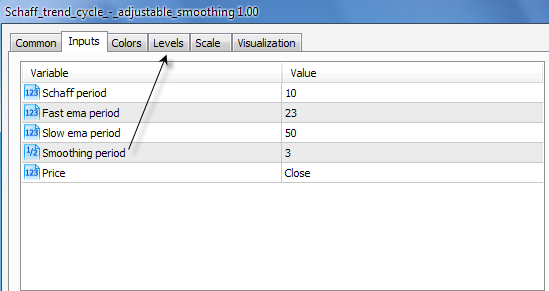
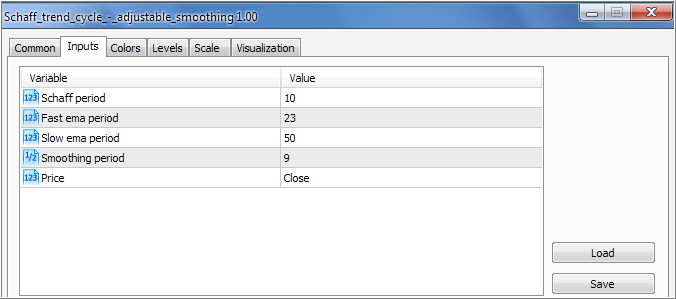
- Schaff trend cycle - adjustable smoothing - indicator for MetaTrader 4
- Schaff trend cycle - adjustable smoothing - indicator for MetaTrader 5
- RSI Floating Levels - indicator for MetaTrader 5
- and many many other indicators from the CodeBase.
============
Example to use those levels: +135 pips

============
Forum on trading, automated trading systems and testing trading strategies
BRAINWASHING SYSTEM/ASCTREND SYSTEM
Sergey Golubev, 2017.08.21 14:41
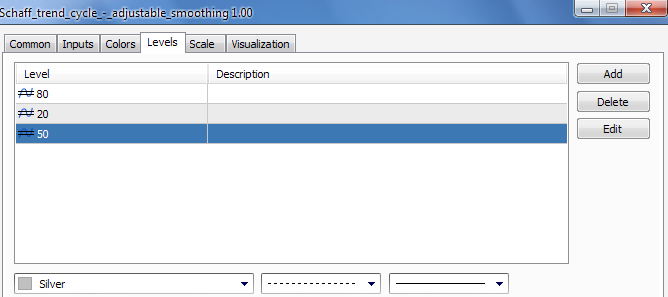
And do not forget to add the levels in Schaff trend cycle - adjustable smoothing indicator
The forum threads/posts about it
- What does it mean a currency to be Overbought and Oversold? - the thread
- Overbought vs. Oversold - the post with mini-article
- RSI based overbought / oversold levels - small thread with indicator (MT4)
- Video Lessons - Ichimoku With Oversold and Overbought Levels - the post with video
- Video Lessons - Overbought and Oversold levels - the post with video
- Stochastic - small thread with trading system based on standard indicators in Metatrader
- Something Interesting to Read - Theory Of Stochastic Processes - the thread with the books
Trading system based on overbought/oversold levels.
============
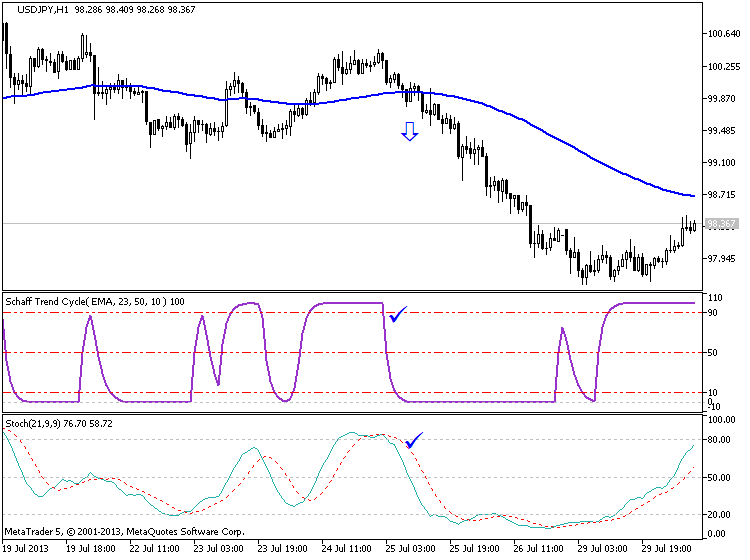
Schaff Trend Cycle with EMA 100
1. Time Frame: 15 min and above
2. Pairs: Any
3. Indicators:
- Schaff Trend Cycle
- Ema 100
- Stochastich (21, 9,9)
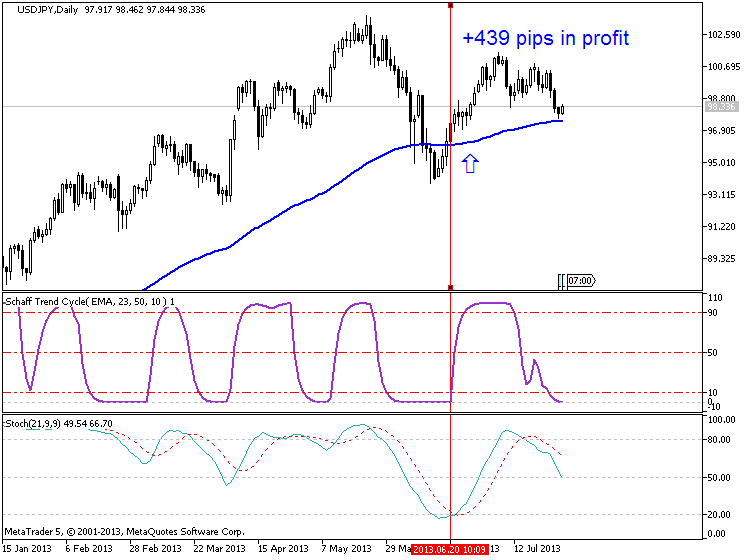
Rules to enter a long trade
- The 100 exponential moving average is sloping up.
- Wait for the Schaff Trend Cycle to reach oversold territory on the chart (-10 +10), go long when the Schaff Trend Cycle turns back above 10, and Stocastich crosses line up
- Place stop 10 pips below the most recent level of support.
- Take profit: Close the trade if the Schaff Trend Cycle indicator goes below 90
Rules to enter a short trade
- The 100 exponential moving average is sloping down
- Wait for the Schaff Trend Cycle to reach overbought territory on the chart (90-110), go short when the Schaff Trend Cycle turns back below 90, and Stocastich crosses line down.
- Place stop 3 pips above the most recent level of resistance.
- Take profit: Close the trade if the Schaff Trend Cycle indicator moves down to -10 and then rises back above +10
Template is attached. If you instal indicatiors and use this template so you will get the chart like that:
- www.metatrader5.com
And this is the EA (for MT4) working in overbought/oversold levels (using stochastic indicator):
Forum on trading, automated trading systems and testing trading strategies
Sergey Golubev, 2016.03.28 14:13
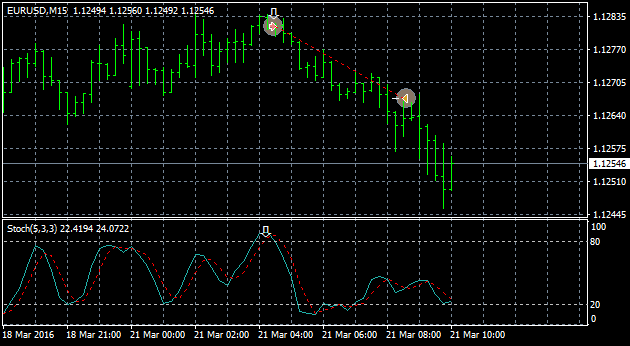
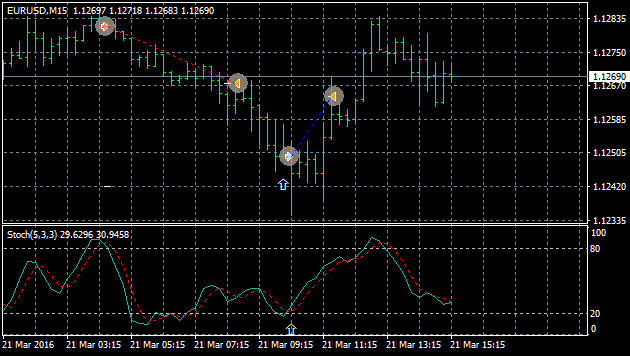
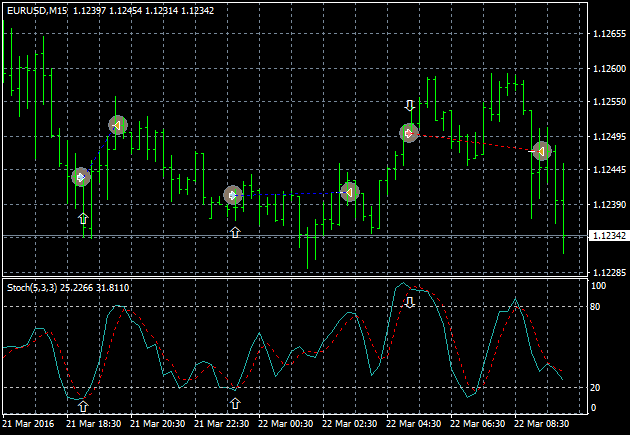
This is very good EA for newbies - for the traders who are learning Stochastic indicator about how it works. EA is trading on overbought/oversold levels of Stochastic indicator with the following parameters which were coded to be inside this EA:
- the parameters of Stochastic indicator which were coded inside this EA: 5/3/3
- overbought/oversold levels to be coded in EA: 80/20
- "Advisor analyzes the readings of the indicator Stochastic has, signal for buying is the intersection of the main and signal indicator lines in the oversold zone, a signal for the intersection of sales is the main indicator and signal lines in the overbought zone."
The coder proposed set file for this EA so we may use this EA on EURUSD M15 timeframe according to this set file/parameters.
I backtested EA just to see how it works - please find backtesting results and some charts with the ideas about overbought/oversold levels:
Brainwashing system example -
Forum on trading, automated trading systems and testing trading strategies
BRAINWASHING SYSTEM/ASCTREND SYSTEM
Sergey Golubev, 2017.08.21 14:36
There are two indicators which can be used together with this system (to filter possible false signals):
- Schaff Trend Cycle - indicator for MetaTrader 5
- Schaff trend cycle - adjustable smoothing - indicator for MetaTrader 5
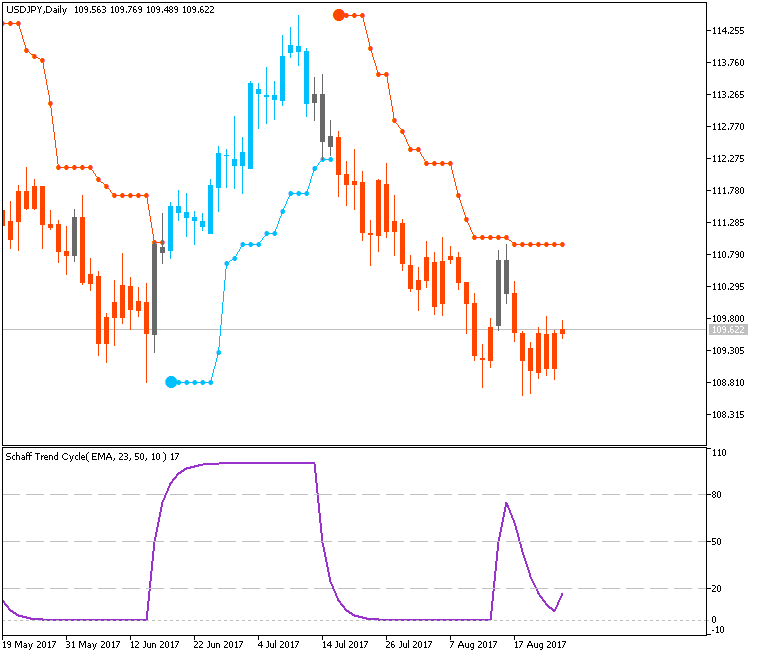
And this is the chart to evaluate those 2 indicators about how it works:

Both indicators are used with default settings except Smoothing period for Schaff trend cycle - adjustable smoothing (I changed Smoothing period from default one to 9).
schaff trend cycle is not working,on compiling it shows the following error.
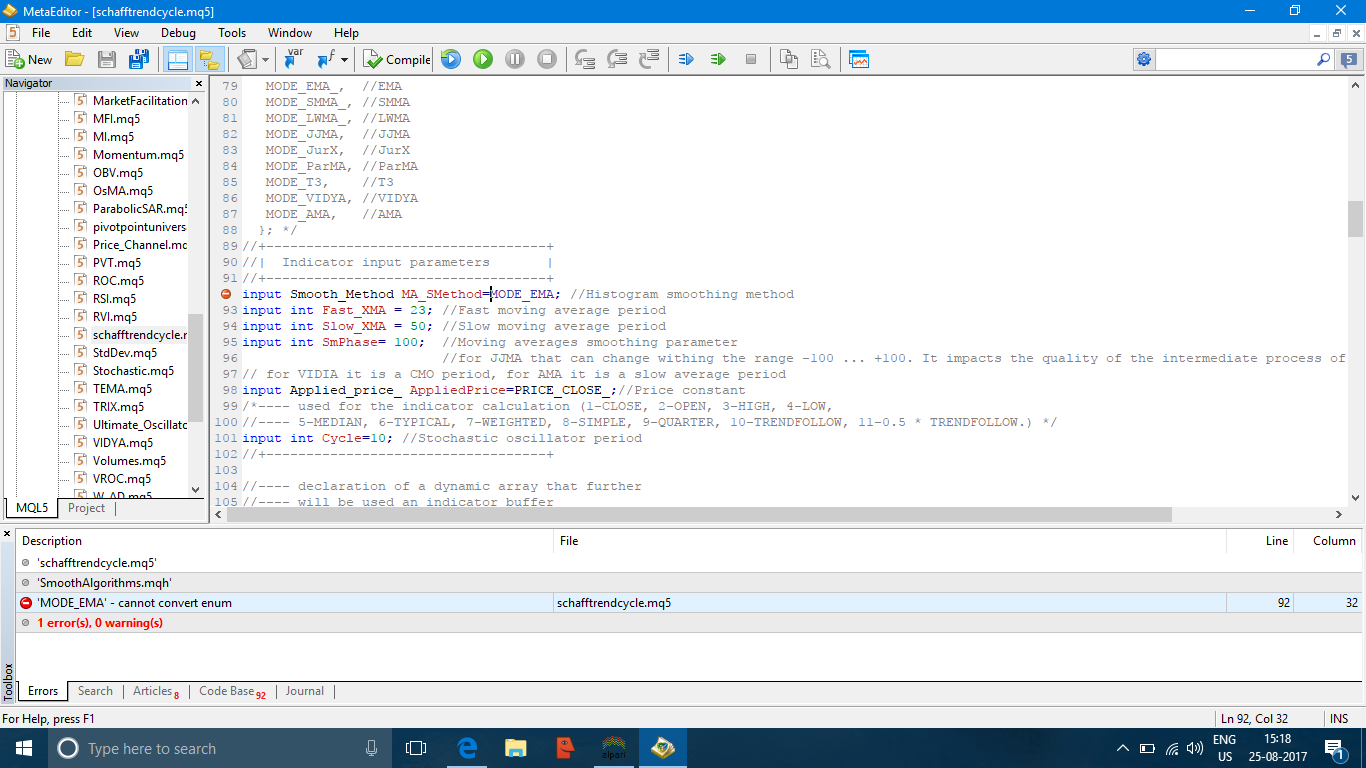
schaff trend cycle is not working,on compiling it shows the following error.
I changed something in the code so it should work now (attached).
This is the other setup (the settings of the indicator):
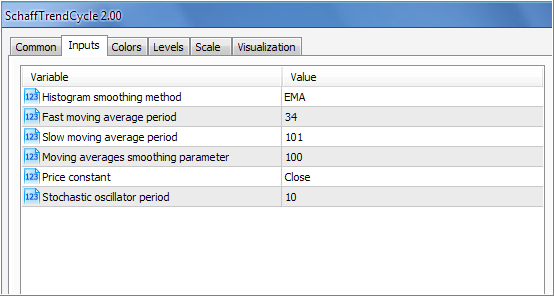
============
Example to use those levels: +135 pips
============
It seems that pips on the image are not net profits ... right?
Not sure, but they look like the differences between the highs and the lows of the related swings.
Ps. I could not quote the image in your post. As guessed, it is the first image in your first post.
It seems that pips on the image are not net profits ... right?
Not sure, but they look like the differences between the highs and the lows of the related swings.
Ps. I could not quote the image in your post. As guessed, it is the first image in your first post.
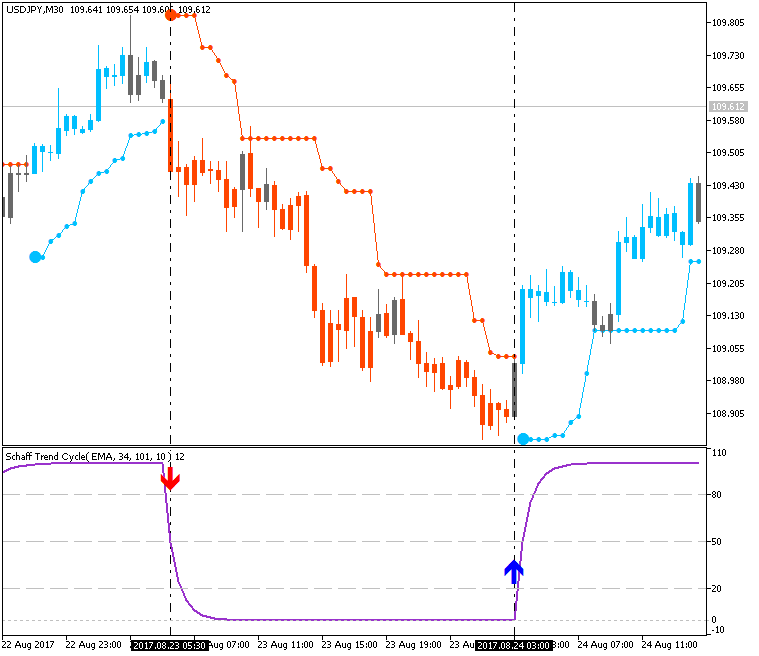
First chart on this thread "with pips"?
It is the illustration about 'possible good situation' in case we are trading schaff trend cycle indicator (in separate window) only on the way as overbought/oversold: buy if the value of the indicator is below 20, and sell if the value of the indicator is above 80 (for example) ... or crossing 20 or 80 to below or above ... depends on the coding for the EA for example.
- Free trading apps
- Over 8,000 signals for copying
- Economic news for exploring financial markets
You agree to website policy and terms of use
is there any oscillator or indicator, which shows that prices are oversold/overbought with respect to last day/last week open/close price.
and how accurate is that oscillator,which time frame they are close to result.