please suggest a good oscillator
Forum on trading, automated trading systems and testing trading strategies
Sergey Golubev, 2016.07.21 18:16
Introduction to Technical Indicators - Oscillators: RSI, Stochastics, CCI, MACD (based on the article)
Oscillators give traders an idea of how momentum is developing on a
specific currency pair. When price treks higher, oscillators will move
higher. When price drops lower, oscillators will move lower. Whenever
oscillators reach an extreme level, it might be time to look for price
to turn back around to the mean. However, just because an oscillator
reaches “Overbought” or “Oversold” levels doesn’t mean we should try to
call a top or a bottom. Oscillators can stay at extreme levels for a
long time, so we need to wait for a valid sign before trading.
RSI
The Relative Strength Index is arguably the most popular oscillator out
there. A big component of its formula is the ratio between the average
gain and average loss over the last 14 periods. The RSI is bound between
0 – 100 and is considered overbought above 70 and oversold when below
30. Traders generally look to sell when 70 is crossed from above and
look to buy when 30 is crossed from below.
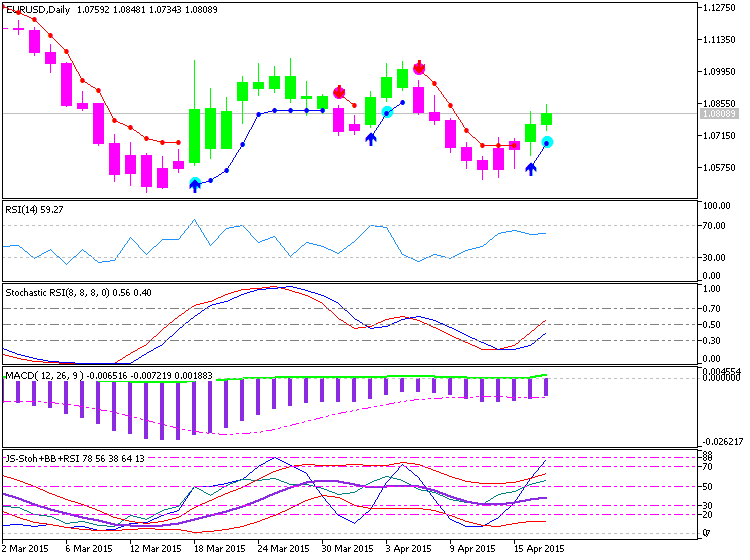
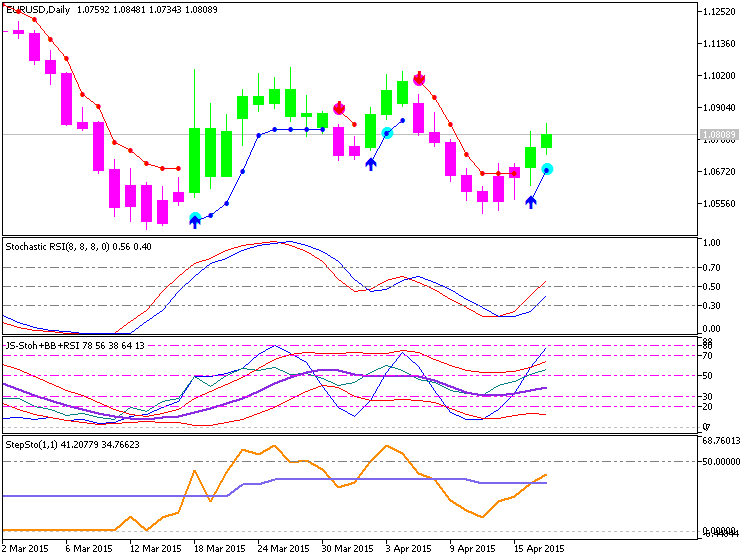
Stochastics
Stochastics offer traders a different approach to calculate price
oscillations by tracking how far the current price is from the lowest
low of the last X number of periods. This distance is then divided by
the difference between the high and low price during the same number of
periods. The line created, %K, is then used to create a moving average,
%D, that is placed directly on top of the %K. The result is two lines
moving between 0-100 with overbought and oversold levels at 80 and 20.
Traders can wait for the two lines to crosses while in overbought or
oversold territories or they can look for divergence between the
stochastic and the actual price before placing a trade.
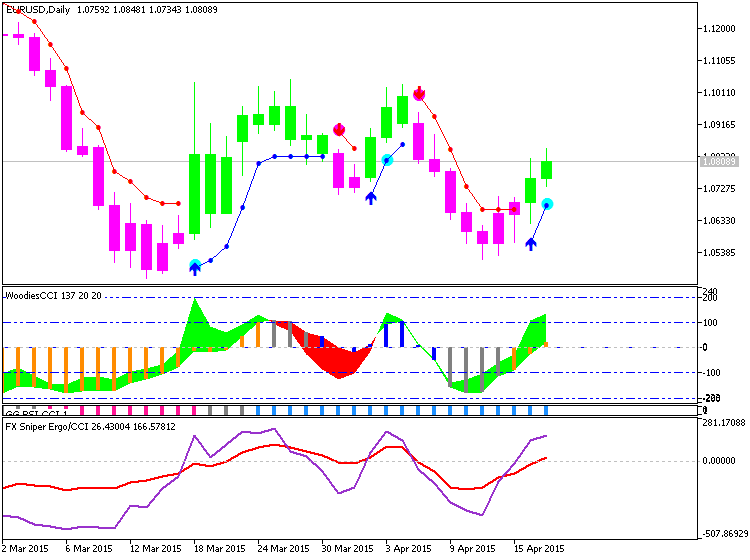
CCI
The Commodity Channel Index is different than many oscillators in that
there is no limit to how high or how low it can go. It uses 0 as a
centerline with overbought and oversold levels starting at +100 and
-100. Traders look to sell breaks below +100 and buy breaks above -100.
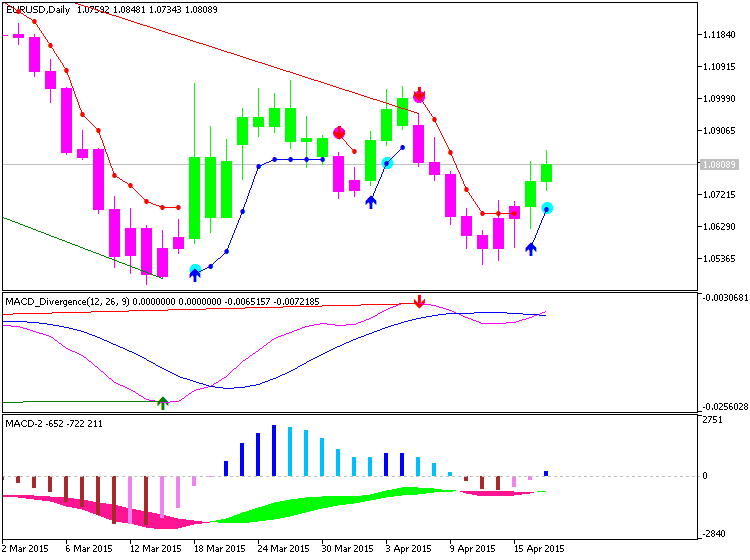
MACD
The Moving Average Convergence/Divergence tracks the difference between
two EMA lines, the 12 EMA and 26 EMA. The difference between the two
EMAs is then drawn on a sub-chart (called the MACD line) with a 9 EMA
drawn directly on top of it (called the Signal line). Traders then look
to buy when the MACD line crosses above the signal line and look to sell
when the MACD line crosses below the signal line. There are also
opportunities to trade divergence between the MACD and price.
how can they be used to identify a trend
They can be used on the following way:
- to identify the trend - if signal line is above the main line and so on;
- to identify the reversal on the way as overbought/oversold.
But the most traders/coders are using them as the filter - to filter possible false signals from the indicators attached on the main window. Means: you are having/downloading some indicators to be attached on the main window of the chart which are producing the signals for buy or sell, and you can use oscillators to filter false buy/sell signals.
Every standard indicator is having some specification here on this portal about how to use in trading and in coding so you can find it here for example.
You can look at the following threads about how to use it (everything with the indicatorts, templates, trading systems, how to trade, EAs for free to download, and the trading statements):
Forum on trading, automated trading systems and testing trading strategies
How to Start with Metatrader 5
Sergey Golubev, 2013.09.20 08:21
Summaries :
====
- How to Start with MT5, a summary !
- All (not yet) about Strategy Tester, Optimization and Cloud
- ASCTREND SYSTEM summary (incl 2 good EAs)
- BRAINTRADING SYSTEM HowTo
- PriceChannel Parabolic system (incl 2 versions of the EA)
- Market Condition Evaluation (2 EAs were created)
- Ichimoku
-
Financial and trading videos - Table of Contents
- All about Calendar tab and Macro Economic Events
- All about MQL5 Wizard : create robots without programming
please suggest a good oscillator,
I had used stochastic,oscillator of moving averages,RSI
please suggest better than this,if any
And for what reason do you need oscillators? when you can study quantitative Naked trading.
- Free trading apps
- Over 8,000 signals for copying
- Economic news for exploring financial markets
You agree to website policy and terms of use
please suggest a good oscillator,
I had used stochastic,oscillator of moving averages,RSI
please suggest better than this,if any