Forecast and levels for GOLD (XAU/USD) - page 2
You are missing trading opportunities:
- Free trading apps
- Over 8,000 signals for copying
- Economic news for exploring financial markets
Registration
Log in
You agree to website policy and terms of use
If you do not have an account, please register
Forum on trading, automated trading systems and testing trading strategies
Press review
Sergey Golubev, 2017.05.06 13:29
Weekly Fundamental Forecast for GOLD (XAU/USD) (based on the article)
XAU/USD - "The biggest event risk into the open will be the results of the presidential election in France with independent centrist Emmanuel Macron now widely expected to pull out a victory of over Marine Le Pen. The risk to the current downtrend would be an upset victory for Le Pen- a scenario that would lead to uncertainty regarding the future of the Euro project as a whole (also a scenario that would likely offer some near-term support in gold prices). That said, the current technical picture continues to point lower targeting a more meaningful support confluence heading into next week."
Forum on trading, automated trading systems and testing trading strategies
Press review
Sergey Golubev, 2017.05.11 06:58
GOLD - price broke intra-day Ichimoku cloud for the bearish trend (based on the article)
H4 price broke intra-day 72/144/288 Ichimoku cloud to below to be reversed to the primary bearish market condition. The price is moved along trendline channel by testing 1214.23 support level to below for the bearish trend to be continuing.
Forum on trading, automated trading systems and testing trading strategies
Press review
Sergey Golubev, 2017.05.19 10:18
Trading Gold and Silver (based on the article)
"Trading gold and silver has become increasingly popular over recent years. More and more Forex brokers are offering trading in gold and silver, as well as some other precious metals such as platinum and palladium, but gold and silver take up most of the speculative interest in this category. In addition to trading precious metals virtually, there are a lot of offers available to buy and sell gold and silver bullion and take physical ownership in the shape of coins, ingots and other collectables; but this article will focus on the online trading of gold and silver."
Gold and Silver Price Behavior
"To trade gold and silver successfully, it is important to put thoughts of the commodity itself out of your mind and just focus on the behavior of its price. Gold and silver prices are traditionally quoted in U.S. Dollars, but some brokers will price it in Euros and other currencies. If you do trade these metals against currencies other than the U.S. Dollar, do keep in mind that most of the world watches it against the U.S. Dollar, so keep an eye on what is going on there."
Gold and Silver Trading Method
"If you are reading this and thinking that trend trading gold and silver is the way to go, you are probably on the right track: as with Forex currency pairs, trading in the direction of the multi-month movement in price has been a profitable strategy in recent years, although over a somewhat longer-term time frame, with the six-month trend being most predictive overall. This result is arguably distorted, however, by the fact that the precious metals have generally been buoyant against national currencies, and here we get close to the hearts of those who believe that all non-convertible, fiat currencies are inevitably eventually debased against widely accepted stores of value such as precious metals. It is certainly true that it is hard to find a strategy which has been profitable in recent history over the long-term which is based upon shorting gold and silver against currencies. Time of day, contrary to popular myth, is not especially important."
Gold or Silver?
"Gold and silver have a high positive correlation, i.e. they tend to fluctuate in value together. To give you an idea as to how this has worked in recent years, look at the chart below showing both against the U.S. Dollar."
Gold and Silver Trading Strategy
"Finally, how could you build a trading strategy for these precious metals? Trend trading strategies typically have produced the best results. Well, they both tend to move fast and quite explosively, so buying new highs in strong uptrends when the price is above its level from 6, 3 and 1 months back has been a successful method, especially when using volatility rather than candle-based stops. With commodities such as these, it has been very profitable to sit back and let winning trades run and run."
Forum on trading, automated trading systems and testing trading strategies
Press review
Sergey Golubev, 2014.05.18 06:18
Gold Is Not Stable After All
I like gold. My wedding ring is simple but classy. My crowns in my mouth are so good that I forget they are there. The electronic contacts in my computer work just fine. Gold is great. But not as a steady measure of purchasing power, nor as a guaranteed investment.
“Gold has the same purchasing power today that it had in 1913,” I continue to read. So let’s look at the data and see what we can conclude about gold, its stability and purchasing power, and then we’ll turn to gold as an investment.
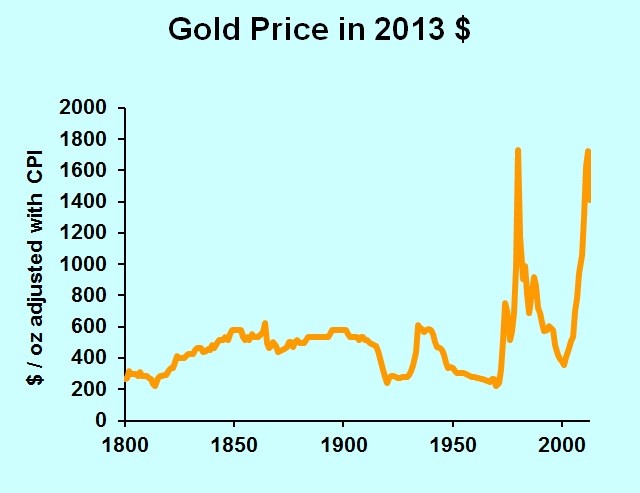
To get an idea of the purchasing power of an ounce of gold, we’ll adjust the gold price by the Consumer Price Index. (I’ve noted elsewhere that Long-term Inflation estimates are misleading, but they are what we’ve got. Just keep in mind that your purchasing power has risen more than the CPI indicates.)
The chart shows a fairly steady price of gold for most of our history, followed by two giant spikes. We’ll get to the spikes later, but let’s narrow in on the seemingly steady period. It turns out that the era from 1800 through 1972 looks steady because those spikes require the chart’s vertical axis to be up at $2000.
If you had bought gold in 1800, you would have increased your purchasing power by 13 percent in five years. That’s not quite a stable measure of purchasing power, but given the accuracy of our price statistics, it’s in the ballpark. As an investment however, note that 13 percent over five years is lousy when interest rates are six to seven percent per year, as they were back then.
Pity, though, the person who bought gold in 1805. In nine years, his gold had lost 26 percent of its purchasing power. Gold was neither a stable measure of value nor a good investment.
The next few decades were good for gold owners. The gold price was steady while consumer prices fell. From the 1814 low until the start of the Civil War, the purchasing power of an ounce of gold more than doubled.
The inflationary years of the Civil War showed gold’s value in a time of crisis. Consumer prices rose 74 percent from 1861 through 1864, but the price of gold doubled.
Now let’s fast forward to the two spikes in the gold price series. In 1980, gold averaged $613 an ounce, though on the best day it traded at $850. By 1982 gold was trading the low $300s. It turns out that the Federal Reserve got serious about fighting inflation just as investors got serious about using gold to hedge against inflation. Ouch.
Then we had another run-up in 2011-12, with gold hitting a daily high of $1,781. As I am writing, May 15, 2014, gold is trading at just under $1,300, off 27 percent from its peak of a few years ago.
Instead of belaboring the data, let’s just say that gold’s value goes up and down. It is not a steady measure of value or purchasing power. Like all other assets, its value is not intrinsic; it has value only as people are willing and able to pay for it. That willingness and ability come and go, and thus gold’s value will rise and fall in the future.
Forum on trading, automated trading systems and testing trading strategies
Press review
Sergey Golubev, 2017.05.20 09:55
Gold Intra-Day Price: bullish ranging for correction (based on the article)
H4 price is above Ichimoku cloud in the bullish area of the chart: the price is testing 1245 support level to below for the secondary correction to be started.
Forum on trading, automated trading systems and testing trading strategies
Press review
Sergey Golubev, 2017.05.26 07:38
Gold - weekly ranging within the cloud; 1295 level is the key (based on the article)
Weekly price is on ranging within Ichimoku cloud within 1295/1214 levels waiting for the direction of the bullish reversal to bestarted or to the bearish trend to be resumed.
Forum on trading, automated trading systems and testing trading strategies
Press review
Sergey Golubev, 2017.06.01 14:50
Intra-Day Fundamentals - GBP/USD, Dollar Index and GOLD (XAU/USD): ADP Non-Farm Employment Change
2017-06-01 13:15 GMT | [USD - ADP Non-Farm Employment Change]
if actual > forecast (or previous one) = good for currency (for USD in our case)
[USD - ADP Non-Farm Employment Change] = The indicator characterizes the labor market and industrial sector activity to assess the economic development in the country. Employment growth exceeding the predicted value is seen as positive for the US dollar.
==========
From official report:
==========
GBP/USD M5: range price movement by ADP Non-Farm Employment Change news events
==========
Dollar Index M5: range price movement by ADP Non-Farm Employment Change news events
==========
XAU/USD M5: range price movement by ADP Non-Farm Employment Change news events
Forum on trading, automated trading systems and testing trading strategies
Press review
Sergey Golubev, 2017.06.06 16:26
What is the Correlation between the Dollar Index and Gold (based on the article)
---------------
The following CodeBase indicator was used to provide the chart about: MFCS Currency Correlation Chart
Forum on trading, automated trading systems and testing trading strategies
Press review
Sergey Golubev, 2017.06.14 14:57
Intra-Day Fundamentals - Dollar Index and GOLD (XAU/USD): U.S. Consumer Price Index
2017-06-14 13:30 GMT | [USD - CPI]
if actual > forecast (or previous one) = good for currency (for USD in our case)
[USD - CPI] = The Consumer Price Index m/m measures changes in prices of a basket of consumer goods and services in the given month compared to the previous one. The index shows price changes from the perspective of the consumer.
==========
From official report:
==========
Dollar Index M5: range price movement by Consumer Price Index news events
==========
XAU/USD M5: range price movement by Consumer Price Index news events