Elite indicators :) - page 560
You are missing trading opportunities:
- Free trading apps
- Over 8,000 signals for copying
- Economic news for exploring financial markets
Registration
Log in
You agree to website policy and terms of use
If you do not have an account, please register
ValeoFX
I answer whenever I see that the coding job that has to be done is in fact some kind of improvement or of some kind of benefit for all. The "improved" rsi failed to convince me that there is anything improved in it. Nothing personal, but that indicator is a whole lot of things thrown together that, in my opininion just make it a mess to look at and that (along with coding mess in the code itself) was the reason I did not do anything on it
Mladen, have I upset you in any way? Not that I think I have, but I need to check as you have been ignoring me for a while and not your normal way of doing things.
Schaff trend cycle of averages
Schaff trend cycle of averages
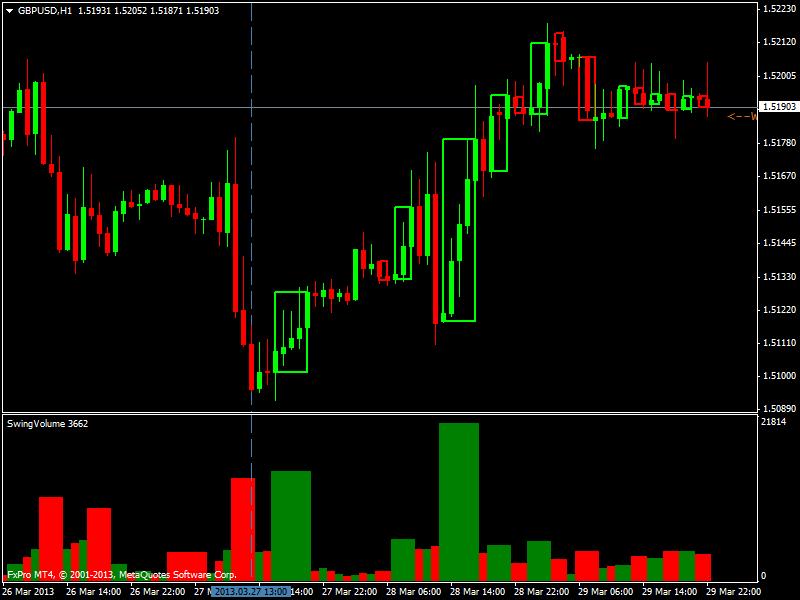
The Shcaff trend cycle of averages extended with 18 types of averages that can be chosen instead of the built in averages. Averages types are the following :can someone make an indicator that would draw aggregated candles (either color-filled or empty) corresponding on aggregated volumes, just like in this half of the chart (i made them manually) -
here's the volume indicator. thank you in advance!!
can someone make an indicator that would draw aggregated candles (either color-filled or empty) corresponding on aggregated volumes, just like in this half of the chart (i made them manually) -
here's the volume indicator. thank you in advance!!scrat
That indicator uses "ay-SwingClose" indicator in calculation - so it misses that indicator in order to work OK
here it is.
scrat That indicator uses "ay-SwingClose" indicator in calculation - so it misses that indicator in order to work OK
can someone make an indicator that would draw aggregated candles (either color-filled or empty) corresponding on aggregated volumes, just like in this half of the chart (i made them manually) -

here's the volume indicator. thank you in advance!!Scrat
Swing volume looks like this on my chart. Do you use different indi?
i set modetotal on true.
Scrat Swing volume looks like this on my chart. Do you use different indi?
mladen,
I use multiple timeframes of your Absolute Strength of Averages_mtf 2.03 indicator to create great trades on my template. I've enclosed a picture of how visually complicated it can get when overlaying 3 diff timeframes onto 1 indicator window.
The thick dark red and dark green lines are M15, the dotted green and red lines are M5, and the blue and white lines are M1. all on this M1 chart. Could you please add an optional vertical line onto the indicator as shown in the picture each time there is an initial cross of the 2 lines per each timeframe (green for cross up and red for cross down).
I understand that the final indication of a cross doesn't occur until the bar of that time frame actually closes, and that it can change until that timeframe bar actually closes. These initial lines gives me an immediate graphic picture of how they all initially line up.
Thank you very much for all your help. I appreciate it very much.
traderdp
David
Thank you Mladen. All I wanted to know and most importantly that I did not inadvertently upset you in any way.
Successful week to you.
mladen
could you add the "AlertsOnCurrent" and trend 1 & -1 buffer.
thank you
ray