Press review - page 549


DAX Index - daily bearish ranging with ascending triangle (based on the article)

Daily price is below Ichimoku cloud in the bearish area of the chart: the price is on ascending triangle pattern to be tested together with 12,294 resistance level to above for the secondary rally to be started, otherwise - bearish ranging within the levels.


  • "The area surrounding 12300 has been formidable during the course of the past few weeks, an area which we maintain as an important line-in-the-sand. As long as the DAX stays below then the sideways to downward bias remains intact. Today, we are seeing the market struggle around the trend-line off the June high. Overall, the price action for much of August is beginning to take the shape of a triangle. It won’t be long before it’ll tighten up towards completion."
  • "Given we are still operating within the context of a broken H&S formation and general downtrend it appears likely we would see an eventual break lower with just a little more time for the pattern to mature. If full maturity is to be seen and lower prices as a result then we won’t see a push beyond the low-12300s, and likely not even much of an attempt from here to trade beyond this formidable threshold. If, however, the market does push beyond resistance (especially after a developed triangle) then of course the outlook will be altered and we’ll be certain to take note."
DailyFX
DailyFX
  • www.dailyfx.com
For over a month the DAX has done, well, nothing really. The index is trading right around the same levels it was towards the end of last month when it officially broke the neckline of the . It took some time but the glaring gap from the first round of the French elections was finally filled, and it was not far below the gap-fill in which the...
 

U.S. Commercial Crude Oil Inventories news event: intra-day bullish breakout; daily bullish reversal; 52.28 daily level is the key

2017-08-23 15:30 GMT | [USD - Crude Oil Inventories]

  • past data is -8.9M
  • forecast data is -2.1M
  • actual data is -3.3M according to the latest press release

[USD - Crude Oil Inventories] = Change in the number of barrels of crude oil held in inventory by commercial firms during the past week.

==========

"U.S. commercial crude oil inventories (excluding those in the Strategic Petroleum Reserve) decreased by 3.3 million barrels from the previous week."

 ==========

Crude Oil M5: bullish breakout. The price is located far above 100-SMA/200-SMA reversal levels in the bullish area of the chart: price is testing ascending triangle pattern together with 52.28 resistance level to above for the bullish trend to be continuing..

If M5 price breaks 52.28 resistance level to above on close bar so the bullish trend will be continuing.
If the price breaks 51.65 support level to below on close M5 bar so the bearish reversal will be started.
If not so the price will be on ranging within the levels.


==========

Crude Oil Daily: bullish reversal. The price is ranging within and near 100-SMA/200-SMA ranging area with the resistance level at 52.28 to be tested for the possible bullish reversal.


Brent Crude Oil - daily bullish ranging within 53.50/50.07 levels (based on the article)

Price on the daily chart is above the Ichimoku cloud for the bullish trend area to be ranging within 53.50 resistance level forthe bullish trend to be resum,ed and 50.07 support level for the bearish reversal to be started.


  • "First, the good was that US stockpiles fell for the eighth straight week on rising demand led mainly from refiners. Refiners are processing more oil than last year in the US by 60,000 bpd. Aligning with the end of the likely seasonal peak is the potential of the first Gulf Coast Hurricane, currently named Tropical Depression Harvey, to hit Texas since 2008. However, we could see a direct hit effect refiners more, which are laid across the Gulf and are a key demand point of Oil. There was a strong amount of Latin American Imports coming mainly from Venezuela as well as impressive US gasoline exports that were near 700,000 and at the highest since June. The troublesome point is that seasonality is nearing its likely cycle peak that could mean we are about to see a seasonal drop, which could lead to a stall in the aggressive draws of inventory. "
  • "As mentioned above a breakdown below last week’s low at $45.38/bbl would favor a further breakdown is upon us. However, if we can see a move above last week’s high at $49.13/bbl would be strong since not seen since the last week in July that we’re breaking above resistance from the 2017 downtrend, which could mean we’re about to see a retest of $50/bbl. If such a move is going to happen, this time of year is a good fundamental time for it to occur."

DailyFX
DailyFX
  • www.dailyfx.com
Crude oil looks ready to rally higher, according to shorter term technical analysis. Last week’s low looks to be a strong point of support from Elliott Wave analysis, which holds a potential count where last week’s low was the end of a Bullish Correction. Once a correction is over, trader’s should look for moves higher that can When looking at...
 

GBP/USD Intra-Day FundamentalsU.K. Gross Domestic Product and range price movement 

2017-08-24 09:30 GMT | [GBP - GDP]

  • past data is 0.3%
  • forecast data is 0.2%
  • actual data is 0.3% according to the latest press release

if actual > forecast (or previous one) = good for currency (for GBP in our case)

[GBP - GDP] = Change in the inflation-adjusted value of all goods and services produced by the economy. 

==========

From official report :

  • "UK gross domestic product (GDP) in volume terms was estimated to have increased by 0.3% between Quarter 1 (Jan to Mar) and Quarter 2 (Apr to June) 2017, unrevised from the preliminary estimate."
  • "In the output measure of GDP, growth was driven by services, which grew by 0.5% between Quarter 1 and Quarter 2."

==========

GBP/USD M5: range price movement by U.K. Gross Domestic Product news event 


Intra-Day Fundamentals - NZD/USD, Dollar Index and GOLD (XAU/USD): U.S. Jobless Claims

2017-08-24 13:30 GMT | [USD - Unemployment Claims]

if actual < forecast (or previous one) = good for currency (for USD in our case)

[USD - Unemployment Claims] = The number of individuals who filed for unemployment insurance for the first time during the past week.

==========

From rttnews article :

  • "A report released by the Labor Department on Thursday showed a modest uptick in first-time claims for U.S. unemployment benefits in the week ended August 19th."
  • "The report said initial jobless claims inched up to 234,000, an increase of 2,000 from the previous week's unrevised level of 232,000. Economists had expected jobless claims to rise to 238,000."

==========

NZD/USD M5: range price movement by U.S. Jobless Claims news events


==========

XAU/USD M5: range price movement by U.S. Jobless Claims news events


==========

Dollar Index M5: range price movement by U.S. Jobless Claims news events


News Releases
  • www.dol.gov
In the week ending August 19, the advance figure for seasonally adjusted initial claims was 234,000, an increase of 2,000 from the previous week's unrevised level of 232,000. The 4-week moving average was 237,750, a decrease of 2,750 from the previous week's unrevised average of 240,500. WASHINGTON, DC – The U.S. Department of Labor’s...
 

USD/JPY - daily bearish ranging within 108.60/110.94 for bearish resumed or bullish reversal (based on the article)

Daily price broke Ichimoku cloud for the bearish area of the chart with the ranging within 108.60 support level for the bearish trend to be continuing and 110.94 resistance level for the bullish reversal to be started. Descending triangle pattern was formed by the price to be crossed to below for the beatrish as the most likely direction in this situation for example.


  • "The technical picture of the USD/JPY cross is rather simple. If we see a price break and close below 108.13, all hands will be on deck to see if imminent JPY strength is back and if it can take USD/JPY lower to 107.50 followed by 105.30, the two key support zones in view. If USD/JPY breaks above the recent resistance of 110.37 (Aug. 17 high), we may be seeing a reversal to the top of the long-term range in the 114 zone."
  • "Retail trader data shows 70.1% of traders are net-long with the ratio of traders long to short at 2.34 to 1. In fact, traders have remained net-long since Jul 18 when USDJPY traded near 113.359; theprice has moved 3.8% lower since then. The number of traders net-long is 4.9% higher than yesterday and 19.7% higher from last week, while the number of traders net-short is 3.5% higher than yesterday and 11.7% higher from last week."

DailyFX
DailyFX
  • www.dailyfx.com
do not let friends sell at support. Today is a day to practice that discipline. The JPY has been deceptively strong. An index I run to help me see relative strength and weakness across G10FX shows that JPY remains the strongest currency in the G10 outpacing the EUR, which just closed at the highest level to the GBP since 2009. However, traders...
 

Forum on trading, automated trading systems and testing trading strategies

Press review

Sergey Golubev, 2014.04.24 19:29

Overbought vs. Oversold (baseed on dailyfx article)

  • Overbought means an extended price move to the upside; oversold to the downside.
  • When price reaches these extreme levels, a reversal is possible.
  • The Relative Strength Index (RSI) can be used to confirm a reversal.
Like many professions, trading involves a lot of jargon that is difficult to follow by someone new to the industry. It’s our job as instructors to fill in as many knowledge gaps as possible to make the education process as simple as possible. Today, we will take a look at what it means for a currency pair to be overbought or oversold, and most importantly, what trading opportunities arise from these situations.

Overbought vs. Oversold

These two terms actually describe themselves pretty well. Overbought describes a period of time where there has been a significant and consistent upward move in price over a period of time without much pullback. This is clearly defined by a chart showing price movement from the “lower-left to upper-right” like the chart shown below.

Learn Forex: USDJPY Hourly Chart – Overbought


The term Oversold describes a period of time where there has been a significant and consistent downward move in price over a period of time without much pullback. Basically a move from the “upper-left to the lower-right.”

Because price cannot move in one direction forever, price will turn around at some point. Currency pairs that are overbought or oversold sometimes have a greater chance of reversing direction, but could remain overbought or oversold for a very long time. So we need to use an oscillator to help us determine when a reversal is actually occurring.

But, we must be patient before we enter our trades, because sometimes the RSI can stay overbought or oversold for quite awhile. The worst thing we can do is try to pick a top or a bottom of a strong move that continues to move into further overbought or oversold territory. So we must wait until the RSI crosses back under 70 or crosses back above 30.

When the RSI falls below 30, same rules apply. We want to wait until the RSI crosses back above 30 before we place a buy trade.
Putting RSI to Work


EUR/USD Intra-Day Fundamentals: German Ifo Business Climate and range price movement 

2017-08-25 09:00 GMT | [EUR - German Ifo Business Climate]

  • past data is 116.0
  • forecast data is 115.5
  • actual data is 115.9 according to the latest press release

if actual > forecast (or previous one) = good for currency (for EUR in our case)

[EUR - German Ifo Business Climate] = Level of a composite index based on surveyed manufacturers, builders, wholesalers, and retailers. 

==========

From official report :

  • "The ifo Business Climate Index edged downwards from 116.0 points last month to 115.9 points in August. But sentiment among German businesses remains very strong. The decline was due to slightly less positive assessments of the current business situation. Companies’ short-term business outlook, by contrast, improved. Germany’s economy remains on track for growth."
  • "In manufacturing the index once again broke last month’s record. Companies were slightly less satisfied with their current business situation, which nevertheless remains strong. They expressed greater optimism about the short-term outlook. In the automotive sector cartel allegations and the diesel affair have not been reflected in the survey results to date, with the business climate index remaining at a very high level."

==========

EUR/USD M5: range price movement by German Ifo Business Climate news event 

CESifo Group Munich - ifo Business Climate Index
  • www.cesifo-group.de
The ifo Business Climate Index is a highly-regarded early indicator of economic developments in Germany published on a monthly basis. Detailed results of the ifo Business Survey are published in the ifo Konjunkturperspektiven (in German).
 

Intra-Day Fundamentals - EUR/USD and Dollar Index: Fed Chair Yellen Speech

2017-08-25 15:00 GMT | [USD - Fed Chair Yellen Speech]

[USD - Fed Chair Yellen Speech] = Speech about financial stability at the Federal Reserve Bank of Kansas City Economic Symposium, in Jackson Hole.

==========

From marketwatch article :

  • "In a speech at Jackson Hole symposium, Yellen defended postcrisis banking regulations and spoke about the financial system instead."
  • "U.S. stocks pared gains but remained in positive Friday as investors appeared disappointed that Federal Reserve Chairwoman Janet Yellen offered no clues to the central bank’s monetary policy path."

==========

EUR/USD M5: range price movement by Fed Chair Yellen Speech news events


==========

Dollar Index M5: range price movement by Fed Chair Yellen Speech news events


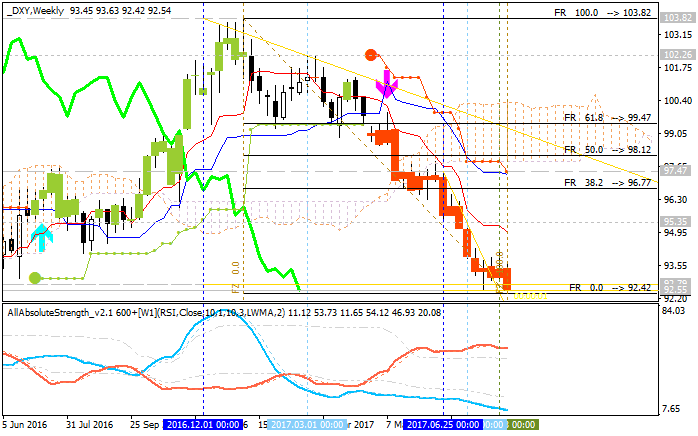
Weekly Outlook: 2017, August 27 - September 03 (based on the article)

The US dollar was on the back foot across the board in the last full week of August. An update on US GDP, consumer confidence, and the all-important Non-Farm Payrolls stand out. 


    1. CB Consumer Confidence: Tuesday, 14:00. A score of 120.3 is on the cards now.
    2. ADP Non-Farm Payrolls: Wednesday, 12:15. Payrolls software provider ADP publishes its jobs report for the private sector and always influences markets. The figures released do not always correlate with the official report by the BLS, but they are still eyed. A gain of 178K was seen in July. A similar gain of 186K is projected.
    3. US GDP (second release): Wednesday, 12:30. A small upgrade to 2.7% is expected in the second release.
    4. Euro-zone CPI: Thursday, 9:00. CPI is predicted to rise to 1.4% y/y while core CPI is expected to remain unchanged.
    5. Canadian GDP: Thursday, 12:30. A slower growth rate of 0.1% is on the cards now.
    6. US Core PCE: Thursday, 12:30. After core CPI remained unchanged at 1.7% y/y, the core PCE number will likely stand at 1.4% y/y. A rise of 0.1% is on the cards. Note that the report also includes personal spending and personal income.
    7. US Pending Home Sales: Thursday, 14:00. A gain of 0.6% is likely.
    8. Chinese Caixin Manufacturing PMI: Friday, 1:45. A minor tick down to 51 is forecast.
    9. US Non-Farm Payrolls: Friday, 12:30. Expectations stand at a gain of 180K jobs and no change of the unemployment rate, which stood at 4.3%. Wages are expected to rise by 0.2% m/m.
    10. US ISM Manufacturing PMI: Friday, 14:00. A small rise to 56.5 is expected.
    Forex Weekly Outlook - Aug. 28 - Sep. 1 2017 | Forex Crunch
    Forex Weekly Outlook - Aug. 28 - Sep. 1 2017 | Forex Crunch
    • 2017.08.25
    • Yohay Elam
    • www.forexcrunch.com
    The US dollar was on the back foot across the board in the last full week of August. An update on US GDP, consumer confidence, and the all-important Non-Farm Payrolls stand out. Here are the highlights for the upcoming week. Updates: CB Consumer Confidence: Tuesday, 14:00. The Conference Board’s consumer confidence measure surprised in July by...
    Reason: