Press review - page 419
You are missing trading opportunities:
- Free trading apps
- Over 8,000 signals for copying
- Economic news for exploring financial markets
Registration
Log in
You agree to website policy and terms of use
If you do not have an account, please register
Forum on trading, automated trading systems and testing trading strategies
Forecast for Q3'16 - levels for Brent Crude Oil
Sergey Golubev, 2016.07.20 16:43
U.S. Commercial Crude Oil Inventories news event: bullish ranging above bearish reversal
2016-07-20 14:30 GMT | [USD - Crude Oil Inventories]
[USD - Crude Oil Inventories] = Change in the number of barrels of crude oil held in inventory by commercial firms during the past week.
==========
"U.S. commercial crude oil inventories (excluding those in the Strategic Petroleum Reserve) decreased by 2.3 million barrels from the previous week."
==========
Crude Oil M5: breaking 200 SMA for the bullish reversal. The price is testing 200 SMA to above for the reversal to the primary bullish market condition.
If the price breaks 46.65 resistance level so the reversal of the intra-day price movement from the primary bearish to the primary bullish market condition will be started.If the price breaks 45.88 support so the intra-day primary bearish trend will be continuing.
If not so the price will be on ranging within the levels.
Trading News Events: European Central Bank (ECB) Interest Rate Decision (adapted from the article)
2016-07-21 11:45 GMT | [EUR - Minimum Bid Rate]
if actual > forecast (or previous one) = good for currency (for EUR in our case)
[EUR - Minimum Bid Rate] = Interest rate on the main refinancing operations that provide the bulk of liquidity to the banking system.
==========
What’s Expected:Why Is This Event Important:
"With the U.K.’s imminent exit from the European Union (EU) clouding the economic outlook for the monetary union, ECB President Mario Draghi may take additional steps to insulate the euro-area, and the Governing Council may extend the duration as well as the scope of its quantitative easing (QE) program in an effort to encourage a stronger recovery."
==========
EUR/USD H1: ranging inside Ichimoku cloud for direction. The price is located inside Ichimoku cloud for the ranging condition within the following key reversal support/resistance levels:
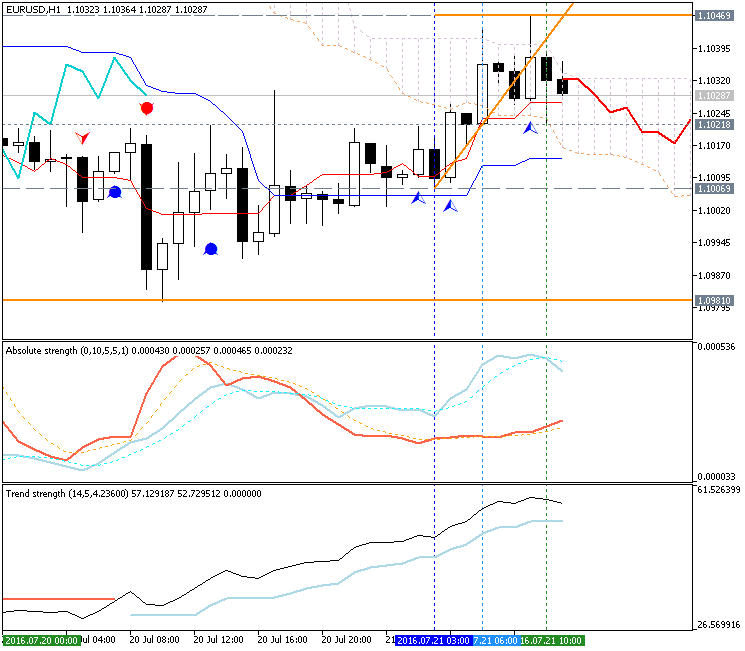
If the price breaks 1.1006 support level to below on close H1 bar so the primary bearish trend will be resumed.If the price breaks 1.1046 resistance to above on close H1 bar so the bullish reversal will be started.
If not so the price will be continuing with the ranging within the levels.
=========
EUR/USD M5: 12 pips price movement by European Central Bank (ECB) Interest Rate news event
GBP/USD Intra-Day Fundamentals: U.K. Retail Sales and and 52 pips price movement
2016-07-21 08:30 GMT | [GBP - Retail Sales]
if actual > forecast (or previous one) = good for currency (for GBP in our case)
[GBP - Retail Sales] = Change in the total value of inflation-adjusted sales at the retail level.
==========
==========
GBP/USD M5: 52 pips price movement by U.K. Retail Sales news event
EUR/USD Intra-Day Fundamentals: Philadelphia Fed Business Outlook Survey and and 42 pips price movement
2016-07-21 12:30 GMT | [USD - Philly Fed Manufacturing Index]
if actual > forecast (or previous one) = good for currency (for USD in our case)
[USD - Philly Fed Manufacturing Index] = Level of a diffusion index based on surveyed manufacturers in Philadelphia.
==========
"The survey’s broadest measure of manufacturing conditions, the diffusion index of current activity, fell from 4.7 in June to -2.9 this month. For nine of the past 11 months, this diffusion index has been negative (see Chart 1). Twenty-two percent of the firms reported an increase in activity, 3 points lower than last month, and the percent of firms that reported decreases rose from 20 to 25. Fifty-one percent of the firms reported steady activity this month, similar to the share that reported steady activity last month."
==========
EUR/USD M5: 42 pips price movement by Philadelphia Fed Business Outlook Survey news event
Introduction to Technical Indicators - Oscillators: RSI, Stochastics, CCI, MACD (based on the article)
Oscillators give traders an idea of how momentum is developing on a specific currency pair. When price treks higher, oscillators will move higher. When price drops lower, oscillators will move lower. Whenever oscillators reach an extreme level, it might be time to look for price to turn back around to the mean. However, just because an oscillator reaches “Overbought” or “Oversold” levels doesn’t mean we should try to call a top or a bottom. Oscillators can stay at extreme levels for a long time, so we need to wait for a valid sign before trading.
RSI
The Relative Strength Index is arguably the most popular oscillator out there. A big component of its formula is the ratio between the average gain and average loss over the last 14 periods. The RSI is bound between 0 – 100 and is considered overbought above 70 and oversold when below 30. Traders generally look to sell when 70 is crossed from above and look to buy when 30 is crossed from below.
Stochastics
Stochastics offer traders a different approach to calculate price oscillations by tracking how far the current price is from the lowest low of the last X number of periods. This distance is then divided by the difference between the high and low price during the same number of periods. The line created, %K, is then used to create a moving average, %D, that is placed directly on top of the %K. The result is two lines moving between 0-100 with overbought and oversold levels at 80 and 20. Traders can wait for the two lines to crosses while in overbought or oversold territories or they can look for divergence between the stochastic and the actual price before placing a trade.
CCI
The Commodity Channel Index is different than many oscillators in that there is no limit to how high or how low it can go. It uses 0 as a centerline with overbought and oversold levels starting at +100 and -100. Traders look to sell breaks below +100 and buy breaks above -100.
MACD
The Moving Average Convergence/Divergence tracks the difference between two EMA lines, the 12 EMA and 26 EMA. The difference between the two EMAs is then drawn on a sub-chart (called the MACD line) with a 9 EMA drawn directly on top of it (called the Signal line). Traders then look to buy when the MACD line crosses above the signal line and look to sell when the MACD line crosses below the signal line. There are also opportunities to trade divergence between the MACD and price.
Introduction to Technical Indicators - Trend Following: Moving Averages, Ichimoku, ADX (based on the article)
Trend following indicators were created to help traders trade currency pairs that are trending up or trending down. We have all heard the phrase “the trend is your friend.” These indicators can help point out the direction of the trend and can tell us if a trend actually exists.
Moving Averages
A Moving Average (MA for short) is a technical tool that averages a currency pair’s price over a period of time. The smoothing effect this has on the chart helps give a clearer indication on what direction the pair is moving either up, down, or sideways. There are a variety of moving averages to choose from. Simple Moving Averages and Exponential Moving Averages are by far the most popular.
Ichimoku
Ichimoku is a complicated looking trend assistant that turns out to be much simpler than it initially appears. This Japanese indicator was created to be a standalone indicator that shows current trends, displays support/resistance levels, and indicates when a trend has likely reversed. Ichimoku roughly translates to “one glance” since it is meant to be a quick way to see how price is behaving on a chart.
ADX
The Average Direction Index takes a different method when it comes to analyzing trends. It won’t tell you whether price is trending up or down, but it will tell you if price is trending or is ranging. This makes it the perfect filter for either a range or trend strategy by making sure you are trading based on current market conditions.
AUD/USD Intra-Day Technical Analysis - bearish ranging within narrow levels (adapted from the article)
H1 price is located below 100 SMA/200 SMA reversal in the primary bearish area of the chart. The price is on ranging within key support/resistance levels waiting for direction.
SUMMARY : ranging
TREND : bearishTechnical Targets for EUR/USD by United Overseas Bank (based on the article)
H4 price is located below Ichimoku in the primary bearish area of the chart: price is on ranging within the following narrow support/resistance levels:
Absolute Strength indicator together with Chinkou Span line are estimating the bear market rally to be started on the secondary ranging way.
Daily price. United Overseas Bank is considering for EUR/USD for the bearish market condition to be continuing with 1.0905/10 and 1.0820 levels as a possible daily target:
"While downward momentum has improved, only a daily closing below 1.1095 would indicate that a move towards 1.0905/10, 1.0820 has started. This scenario still seems likely unless EUR can move back above 1.1120 from here (1.1060 is already a strong short-term resistance)."
Technical Targets for AUD/USD by United Overseas Bank (based on the article)
H4 price is below Ichimoku for the bearish market condition with the ranging within the following key narrow s/r levels:
Absolute Strength indicator is estimating the ranging market condition in the near future.
Daily price. United Overseas Bank is expecting for this pair to be more bearish:
"The price action is line with our expectation but the down-move has been more rapid than expected and a clear break below 0.7445 would greatly increase the odds for further decline to 0.7400, possibly to 0.7330. Overall, this pair is expected to stay under pressure unless it can reclaim 0.7560. On a shorter-term note, 0.7530 is already a strong resistance."
Trading News Events: Canada Consumer Price Index (adapted from the article)
2016-07-22 12:30 GMT | [CAD - CPI core]
if actual > forecast (or previous one) = good for currency (for CAD in our case)
[CAD - CPI core] = Change in the price of goods and services purchased by consumers, excluding the 8 most volatile items.
==========
What’s Expected:Why Is This Event Important:
"Even though BoC Governor Stephen Poloz largely endorses a wait-and-see approach for monetary policy, the central bank may keep the door open to further reduce the benchmark interest rate as the Canadian economy continues to adjust to the oil-price shock."
==========
USD/CAD H1: bullish ranging for correction. The price is located above Ichimoku cloud for the ranging within the following support/resistance levels:
If the price breaks 1.3083 support level to below on close H1 bar so the local downtrend as the secondary correction within the primary bullish trend will be started.
If the price breaks 1.3139 resistance to above on close H1 bar so the bullish trend will be continuing.
If not so the price will be on bullish ranging within the levels.
=========
USD/CAD M5: 37 pips range price movement by Canada Consumer Price Index news event